In my last post I cautioned against using DAX to create a physical table. Segmentation Tables (aka Disconnected) are an exception and worth learning!
Note: see this post for a different dynamic approach.
Segmentation Table
DAX can create a table with adjustable number of rows and increment amount (to segment or bin data into groups). Let’s see how to create it.
I could create a table in Excel (then load into Power BI) or manually create it in Power BI by typing or pasting via ‘Enter data’…
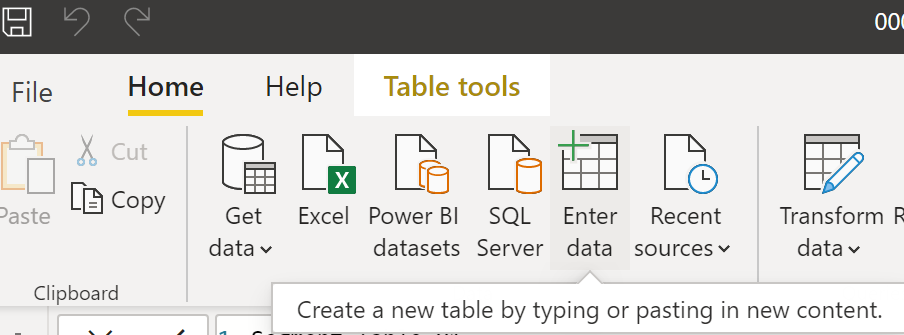
…but I used DAX to create a dynamic adjustable table! Let’s start!
Solution A: CALENDAR
It starts with CALENDAR function. Everything else is built around it.
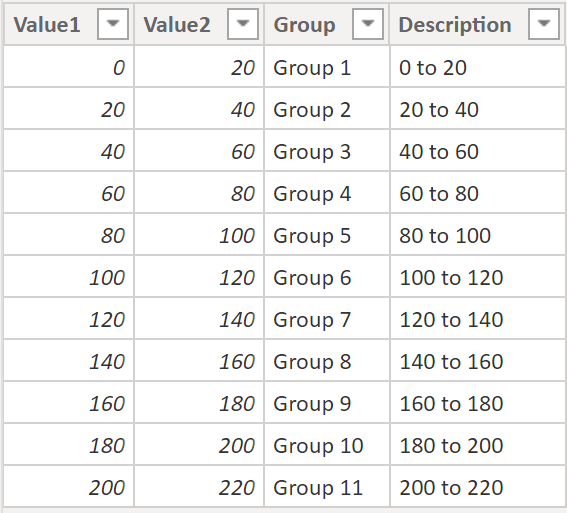
Final DAX code solution A
Segment Table A =
VAR NumberOfRows = 10
VAR SegmentSize = 20
RETURN
SELECTCOLUMNS(CALENDAR(0,NumberOfRows),
              "Value1", INT([Date])*SegmentSize,
              "Value2", INT([Date])*SegmentSize+SegmentSize,
              "Group", "Group " & INT([Date])+1,
              "Description", INT([Date])*SegmentSize & " to " & INT([Date])*SegmentSize+SegmentSize)
Let’s review each step of the process:
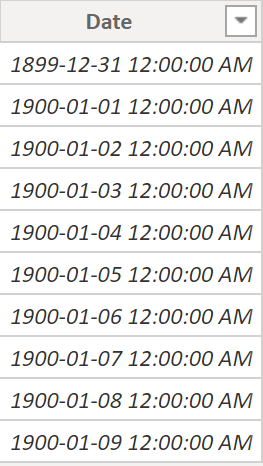
CALENDAR function
Creates a column named ‘Date’ with 10 dates.
Segment Table A1 = CALENDAR(1,10)
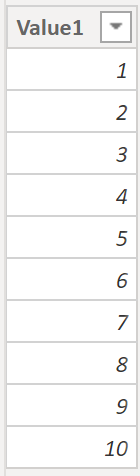
SELECTCOLUMNS function
Adds column [Value1] that converts [Date] to an integer.
Segment Table A2 =
SELECTCOLUMNS(CALENDAR(1,10), "Value1", INT([Date]))
First Variable
VAR indicates variable, variable name is ‘NumberOfRows’, value is 10. It’s used once inside CALENDAR function.
Segment Table A3 =
VAR NumberOfRows = 10
RETURN
SELECTCOLUMNS(CALENDAR(1,NumberOfRows), "Value1", INT([Date]))
Second Variable and Value Columns
Value1 = counter value X SegmentSize variable.
Value2 = counter value X SegmentSize variable + SegmentSize variable.
Segment Table A4 =
VAR NumberOfRows = 10
VAR SegmentSize = 20
RETURN
SELECTCOLUMNS(CALENDAR(0,NumberOfRows),
              "Value1", INT([Date])*SegmentSize,
              "Value2", INT([Date])*SegmentSize+SegmentSize)
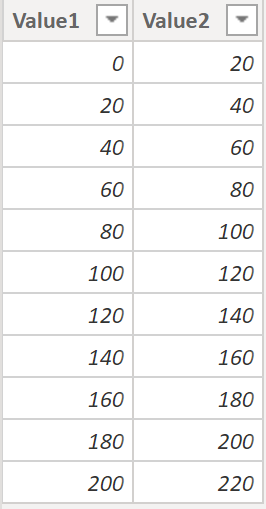
Adding Final Columns
Add columns ‘Group’ and ‘Description’. Finished!
Segment Table A5 =
VAR NumberOfRows = 10
VAR SegmentSize = 20
RETURN
SELECTCOLUMNS(CALENDAR(0,NumberOfRows),
              "Value1", INT([Date])*SegmentSize,
              "Value2", INT([Date])*SegmentSize+SegmentSize,
              "Group", "Group " & INT([Date])+1,
              "Description", INT([Date])*SegmentSize & " to " & INT([Date])*SegmentSize+SegmentSize)
Solution B: GENERATESERIES
A different approach based on GENERATESERIES function.
Final DAX code solution B
Segment Table B =
VAR startval = 0
VAR endval = 200
VAR increment = 20
RETURN
    ADDCOLUMNS (
        GENERATESERIES ( startval, endval, increment ),
        "Value2", [Value] + increment,
        "Group", "Group " & ( ( [Value] - startval) / increment) + 1,
        "Description",[Value] & " to " & [Value] + increment
    )
Let’s review each step of the process:
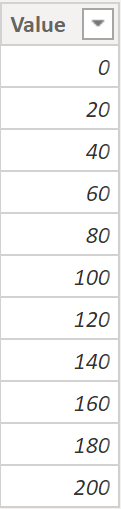
GENERATESERIES function
Starting with hard coded numbers (I’ll add variables later).
Segment Table B1 =
GENERATESERIES(0,200,20)
Add The Variables
Same value column output but this time using variables.
Segment Table B2 =
VAR startval = 0
VAR endval = 200
VAR increment = 20
RETURN
GENERATESERIES(startval,endval,increment)
ADDCOLUMNS function
New column Value2 uses Value1 number and adds increment value to it.
Segment Table B3 =
VAR startval = 0
VAR endval = 200
VAR increment = 20
RETURN
ADDCOLUMNS( GENERATESERIES(startval,endval,increment),
            "Value2", [Value]+increment)
Adding Final Columns
Add Group and Description columns. This is the final code:
Segment Table B4 =
VAR startval = 0
VAR endval = 200
VAR increment = 20
RETURN
ADDCOLUMNS( GENERATESERIES(startval,endval,increment),
            "Value2", [Value]+increment,
            "Group","Group " & (([Value]-startval)/increment)+1,
            "Description",[Value]&" to "&[Value]+increment)
Solution C: Max Segment
Variable UpperMaxAmt increases Upper value of the last group. Why? To include any large outlier values.
Segment Table C =
VAR NumberOfRows = 9
VAR SegmentSize = 20
VAR UpperMaxAmt =
                  ROUNDUP(SegmentSize * NumberOfRows + SegmentSize, -3)
RETURN
    SELECTCOLUMNS(
        CALENDAR(0, NumberOfRows),
        "Lower", INT([Date]) * SegmentSize,
        "Upper",
            IF(
                INT([Date]) = NumberOfRows,
                UpperMaxAmt,
                INT([Date]) * SegmentSize + SegmentSize
            ),
        "Group", "Group " & INT([Date]) + 1,
        "Description",
            INT([Date]) * SegmentSize & " to "
                & IF(
                    INT([Date]) = NumberOfRows,
                    UpperMaxAmt,
                    INT([Date]) * SegmentSize + SegmentSize
                  )
    )
Adjusted Upper Max Value
Note: I used IF function to determine if the current Upper value is the last one. If so I rounded it up, if not Upper = lower value + increment value.
I could make these DAX tables even fancier! Let’s keep going for now.
What Do We Use It For?
I can segment (bin) aggregated data into groups. An example:
30 rows like this in ‘Table1’:

We want this output:
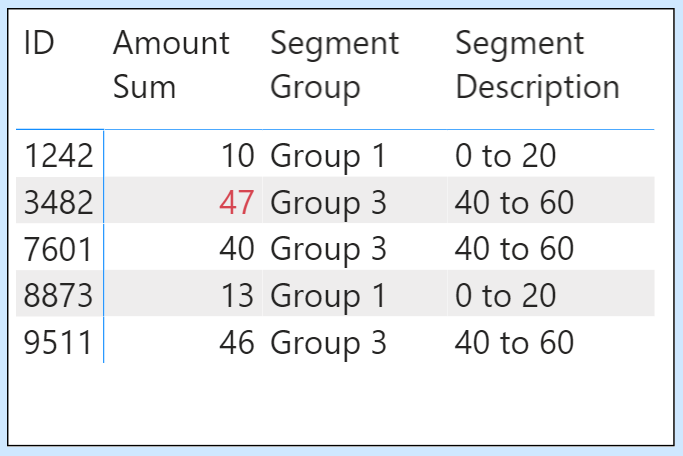
Assign Segment Group & Description based on [Amount Sum].
Let’s examine ID 3482:
- it has 8 rows in Table1
- sum of column Amount = 47
- measure ‘Segment Group’ = “Group 3”
- measure ‘Segment Description’ = “30 to 45”
How does ‘Segment Group’ give us ‘Group 3’ ?
Let’s start with measure [Amount Sum]. In visual above ID 3482 has 47.
Amount Sum = sum(Table1[Amount])
Measure [Amount Sum] is used inside measure [Segment Group] below:
Segment Group =
CALCULATE( SELECTEDVALUE('Segment Table1'[Group]),
FILTER('Segment Table1',
        [Amount Sum] >= 'Segment Table1'[Lower] &&
        [Amount Sum]  < 'Segment Table1'[Upper])
    )
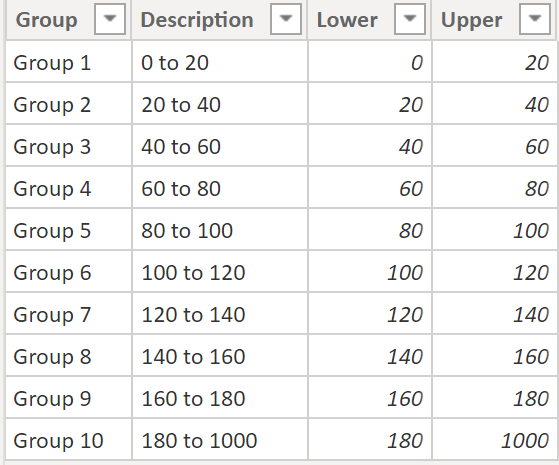
Measure [Segment Group] uses table ‘Segment Table1’ (rows below):

Measure [Segment Group] uses FILTER function to reduce rows in table ‘Segment Table1’ to one row by segmenting (binning) the amount of measure [Amount Sum].
Eg: ID 3482 has an [Amount Sum] of 47 that falls between 40 and 60. SELECTEDVALUE function grabs ‘Group 3’ from column ‘Group’.
Pitfall of this method 🙁
Uneven Group Sizes
There are many practical uses for the DAX method of creating segment tables (aka disconnected tables) but there is a flaw: the increment amount is always the same (except in Solution C). You may not want this.
If you want the custom increment size like this:
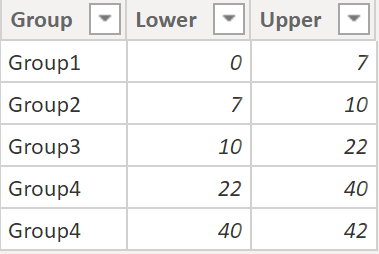
then I can think of 3 options:
- create in Excel and then load it
- manually create table in Power BI (‘Enter data’)
- DATATABLE function (see below) to define values
Segment Uneven DAX =
DATATABLE (
    "Group", STRING,
    "Lower", INTEGER,
    "Upper", INTEGER,
    {
        { "Group1", 0, 7 },
        { "Group2", 7, 10 },
        { "Group3", 10, 22 },
        { "Group4", 22, 40 },
        { "Group5", 40, 42 }
    }
)
Forgotten Values
You may accidentally exclude values (typically small or large values). Eg: your groups are 20 to 40, 40 to 60 and 60 to 80. Values less than 20 and greater than 80 will not be segmented (binned) into any groups.
Maybe you want this but often it’s done in error. However, we could create measures to double check our results. Maybe I’ll make a future post on this!
Summary
It’s easy to create a measure to sum a column in a table. Also easy to split the sum by inserting a column in the row area of the visual. It’s take more effort to create groups for the aggregated amount but it’s possible as we saw above.
This is just a simple example. There are so many ways to use disconnected tables (aka segment tables, bin tables) to enhance your existing data and measures.