I want to segment aggregated data into groups. How can I automate the task of creating these segmentation groups?
Note: similar to previous post but now M.E.C.E. (full automation of all required Lower & Upper groups).
Requirement
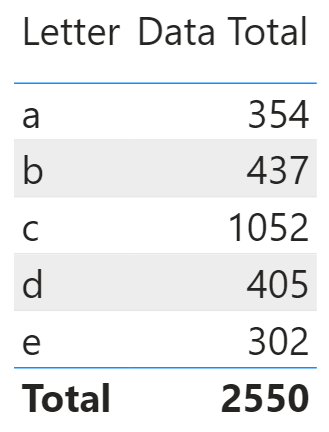
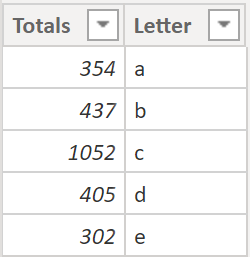
In my final visual I don’t want to see these exact aggregated amounts:
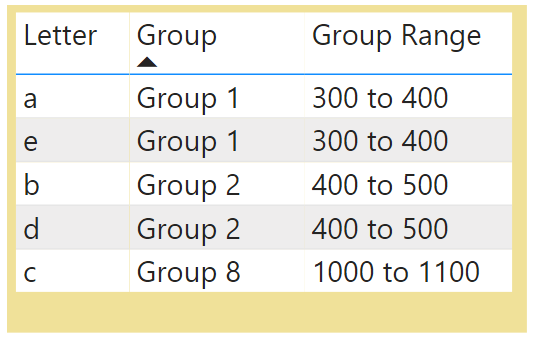
I want to see Group and/or Group Range so it’s easier to read:
I can quickly create groups in Excel (or type them in) but if the data changes an aggregated amount could be accidentally excluded.
How can I automate the creation of these groups to ensure all amounts are segmented? 302 is currently the smallest aggregated amount, 1052 is the largest, group size is 100.
If I get new data, letter “f” with sum of 198, then my visual has to update with new Group Range “100 to 200” for letter “f” and renumbered ‘Group’.
Files: Pbix
Below is the zipped Pbix file:
Final Dynamic Segment Table
There are two final measures in the viz but this dynamic segment table, created using DAX, is the key part of the solution.
3TableDynamicSegment =
VAR AggMin = ROUNDDOWN('2TableAgg'[TableAggMin],-2)
VAR AggMax = '2TableAgg'[TableAggMax]
VAR Increment = 100
VAR RowCount = ROUNDUP(((AggMax-AggMin)/Increment),0)
RETURN
ADDCOLUMNS(
        ADDCOLUMNS(
                        SELECTCOLUMNS(
                                    CALENDAR(1,RowCount),
                                    "Counter", INT([Date])
                        ),
            "Lower", IF([Counter]=1,AggMin,AggMin+Increment*([Counter]-1)),
            "Upper", IF([Counter]=1,AggMin+Increment,AggMin+Increment*([Counter]-1)+Increment)
        ),
    "Desc", "Group " & [Counter],
    "Range",  [Lower] & " to " & [Upper]
)
Set-up
Concept
Arrows point to tables and/or measures that they depend on:
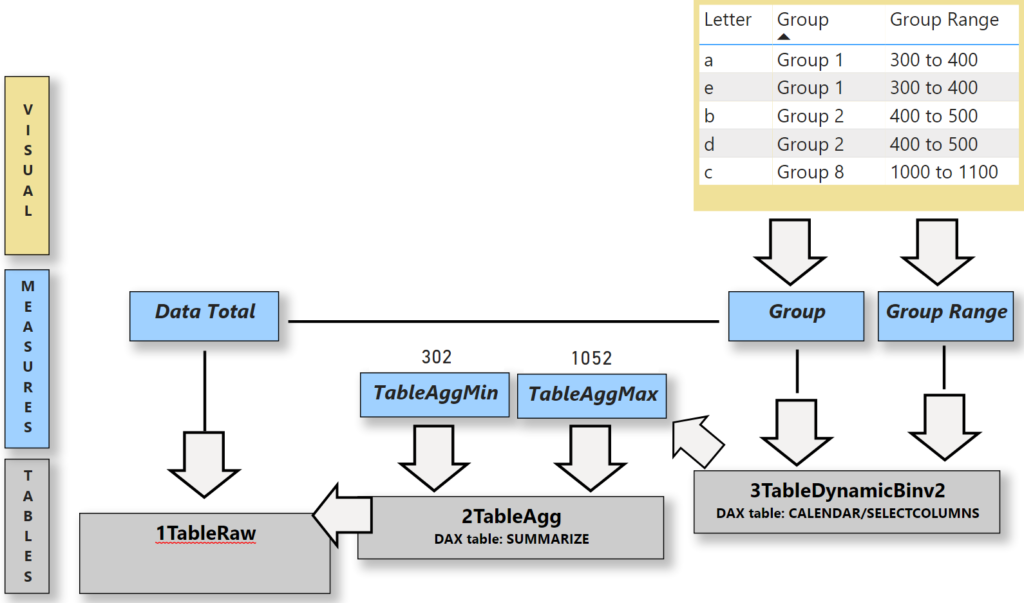
Table 1TableRaw has raw data. All other tables/measures created with DAX.
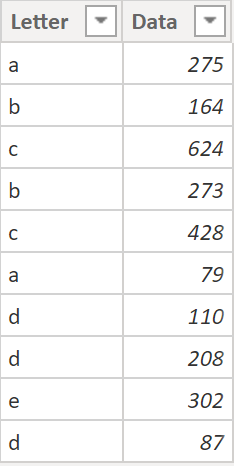
1TableRaw: raw data
I manually created a small 10 row sample table.
Solution
2TableAgg: aggregated data
I used DAX to create this table of aggregated values. I tried to create this virtually using a measure but admitted defeat and did this.
2TableAgg = SUMMARIZE('1TableRaw','1TableRaw'[Letter],"Totals",Sum('1TableRaw'[Data]))
Measures: TableAggMin & TableAggMax
They extract the minimum & maximum aggregated amounts from table 2TableAgg above and are used in table 3TableDynamicSegment:
TableAggMin = MIN('2TableAgg'[Totals])
TableAggMax = MAX('2TableAgg'[Totals])
3TableDynamicSegment
The final measures run each aggregated amount through this table to get ‘Group’ and ‘Group Range’ text.
3TableDynamicSegment =
VAR AggMin = ROUNDDOWN('2TableAgg'[TableAggMin],-2)
VAR AggMax = '2TableAgg'[TableAggMax]
VAR Increment = 100
VAR RowCount = ROUNDUP(((AggMax-AggMin)/Increment),0)
RETURN
ADDCOLUMNS(
        ADDCOLUMNS(
                        SELECTCOLUMNS(
                                    CALENDAR(1,RowCount),
                                    "Counter", INT([Date])
                        ),
            "Lower", IF([Counter]=1,AggMin,AggMin+Increment*([Counter]-1)),
            "Upper", IF([Counter]=1,AggMin+Increment,AggMin+Increment*([Counter]-1)+Increment)
        ),
    "Desc", "Group " & [Counter],
    "Range",  [Lower] & " to " & [Upper]
)
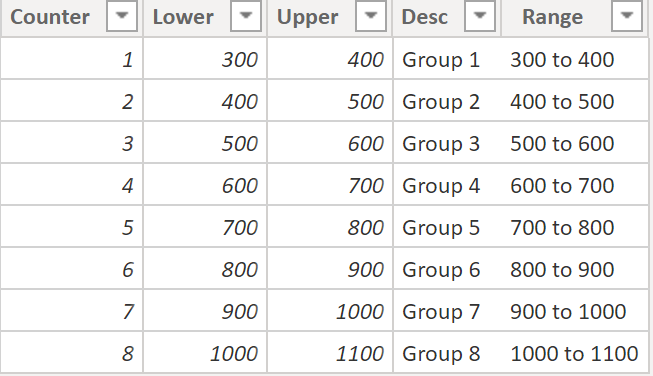
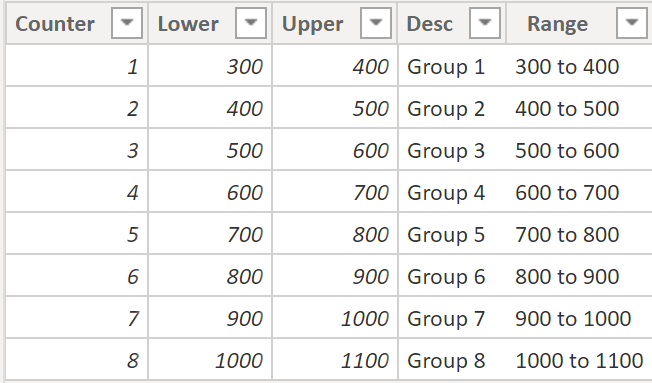
Based on the current aggregated amounts the DAX table above creates this:
Rebuild 3TableDynamicSegment
Let’s re-build this dynamic table step-by-step:
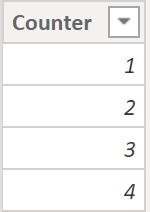
a) create table with 4 rows
z3TableDynamicSegmentA =
SELECTCOLUMNS( //TABLE NAME1 EXPRESSION1
              CALENDAR(1,4),
              "Counter", INT([Date]))
CALENDAR(1,4) creates a 1 column table with 4 rows but the values are date/time. I wrapped it with SELECTCOLUMNS to tidy it up.
Comment //TABLE NAME1 EXPRESSION1 reminded me that SELECTCOLUMNS requires:
- a table: CALENDAR(1,4)
- column name: “Counter”
- dax expression: INT([Date])
b) add variables
Variables will give me the pieces to build a dynamic table. I need:
- smallest & largest aggregated amounts from table 2TableAgg
- group increment amount
- a way to determine the required number of rows
z3TableDynamicSegmentB =
VAR AggMin = ROUNDDOWN('2TableAgg'[TableAggMin],-2)
VAR AggMax = '2TableAgg'[TableAggMax]
VAR Increment = 100
VAR RowCount = ROUNDUP(((AggMax-AggMin)/Increment),0)
RETURN

SELECTCOLUMNS( //TABLE NAME1 EXPRESSION1
              CALENDAR(1,4),
              "Counter", INT([Date]))
Next I’ll use the variables that I added above.
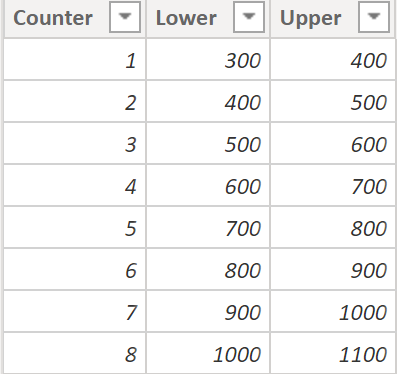
c) dynamic end row & add columns
The number of rows in the table grows/shrinks dynamically due to variable RowCount inside CALENDAR (that’s renamed as “Counter”).
ADDCOLUMNS let’s me add ‘Lower’ & ‘Upper’. Notice the IF function. Row 1 for ‘Lower’ & ‘Upper’ is calculated differently than the remaining rows.
z3TableDynamicSegmentC =
VAR AggMin = ROUNDDOWN('2TableAgg'[TableAggMin],-2)
VAR AggMax = '2TableAgg'[TableAggMax]
VAR Increment = 100
VAR RowCount = ROUNDUP(((AggMax-AggMin)/Increment),0)
RETURN
        ADDCOLUMNS(
                        SELECTCOLUMNS(
                                    CALENDAR(1,RowCount),
                                    "Counter", INT([Date])
                        ),
            "Lower", IF([Counter]=1,AggMin,AggMin+Increment*([Counter]-1)),
            "Upper", IF([Counter]=1,AggMin+Increment,AggMin+Increment*([Counter]-1)+Increment)
        )
At this point our table looks like this:
d) addcolumns
Another ADDCOLUMNS to add ‘Desc’ & ‘Range’. DAX below creates the same table as 3TableDynamicSegment.
z3TableDynamicSegmentD =
VAR AggMin = ROUNDDOWN('2TableAgg'[TableAggMin],-2)
VAR AggMax = '2TableAgg'[TableAggMax]
VAR Increment = 100
VAR RowCount = ROUNDUP(((AggMax-AggMin)/Increment),0)
RETURN
ADDCOLUMNS(
        ADDCOLUMNS(
                        SELECTCOLUMNS(
                                    CALENDAR(1,RowCount),
                                    "Counter", INT([Date])
                        ),
            "Lower", IF([Counter]=1,AggMin,AggMin+Increment*([Counter]-1)),
            "Upper", IF([Counter]=1,AggMin+Increment,AggMin+Increment*([Counter]-1)+Increment)
        ),
    "Desc", "Group " & [Counter],
    "Range",  [Lower] & " to " & [Upper]
)
Finally, our table looks like this:
Final Measures: Group, GroupRange
The final visual looks like this:
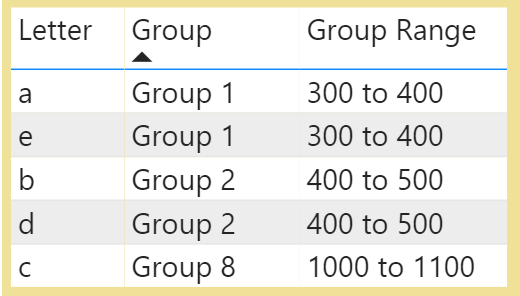
Measures ‘Group’ & ‘Group Range’ take each letter’s aggregated amount and run it through table 3TableDynamicSegment to get the text values. Letter “a” has 354 and falls in ‘Group 1’ and ‘300 to 400’.
Measure: Group
Group =
CALCULATE(
          SELECTEDVALUE('3TableDynamicSegment'[Desc]),
          FILTER(ALL('3TableDynamicSegment'),
                 [Data Total]>='3TableDynamicSegment'[Lower] &&
                 [Data Total] <'3TableDynamicSegment'[Upper])
)
How does measure Group give us ‘Group 1’ ?
FILTER function restricts table 3TableDynamicSegment to a single row for each letter by taking [Data Total] and seeing in which row it fits. Letter ‘a’ sum of 354 fits between the first lower & upper values of 300 to 400.
Function SELECTEDVALUE gets the text value from column Group. For letter a it’s ‘Group 1’.
Measure: Group Range
Group Range =
CALCULATE(
          SELECTEDVALUE('3TableDynamicSegment'[Range]),
          FILTER(ALL('3TableDynamicSegment'),
                 [Data Total]>='3TableDynamicSegment'[Lower] &&
                 [Data Total] <'3TableDynamicSegment'[Upper])
)
‘Group Range’ does the same but returns a text value from column ‘Range’. In a busy dashboard you may want to only show one of these measures.
Summary
This was a big challenge to create. I encountered several roadblocks but I finally got it working. It was an amazing way to practice DAX. One day I’ll try again to create table 2TableAgg virtually inside a measure.
Table 3TableDynamicSegment is referred to as:
- segment table
- bin table
- secondary table
Segment groups should be M.E.C.E. meaning that every aggregated amount falls into a segment and only one segment (so we don’t exclude any value and also don’t double count a value).
The concept is the important part. Once you grasp it you can do all kinds of interesting things!