A fact table can have multiple date fields. I’ve seen this in demos and wanted to practice.
Files: PBIX & XLSX
Excel and PBIX files below:
Concept
A business (eg home renovation) that’s based on a series of dates:
- starts with a Site Visit date
- job estimate created date (Est Created)
- work starts with Job Started date
- work ends with Job Ended date
A sample of questions that arise from this data:
- how many site visits within a given date range?
- what’s the average reno duration?
- what’s the quickest reno?
- how do results compare to the next year?
Set-up
Table: Sales
I used DAX to create a fact table. As it used RANDBETWEEN I copy/pasted to Excel (possible as it’s a small demo) and imported it back as static data.
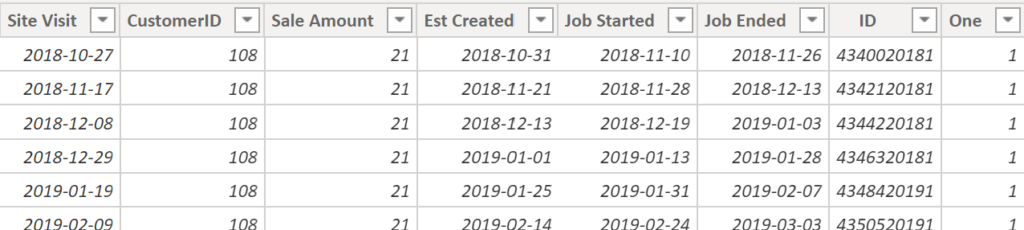
Table: Date
DAX below creates a date table with 4 columns.
Date =
VAR MinYear = YEAR ( MIN ( Sales[Site Visit] ) )
VAR MaxYear = YEAR ( MAX ( Sales[Site Visit] ) )
RETURN

ADDCOLUMNS(
           CALENDAR(DATE(MinYear,1,1),DATE(MaxYear,12,31)),
           "Year", YEAR([Date]),
           "Month Nmbr", MONTH([Date]),
           "Month Name", Format([Date],"mmm")
)
Starting date is Jan 1 of year with 1st sale in Sales (same for Date table end date). Date table ensures all dates are included (needed for time intelligence functions).
Relationship
Below we see that fields Date and Site Visit are used in the relationship.

Later, I’ll use a function to base calculations on an alternative Sales table date field.
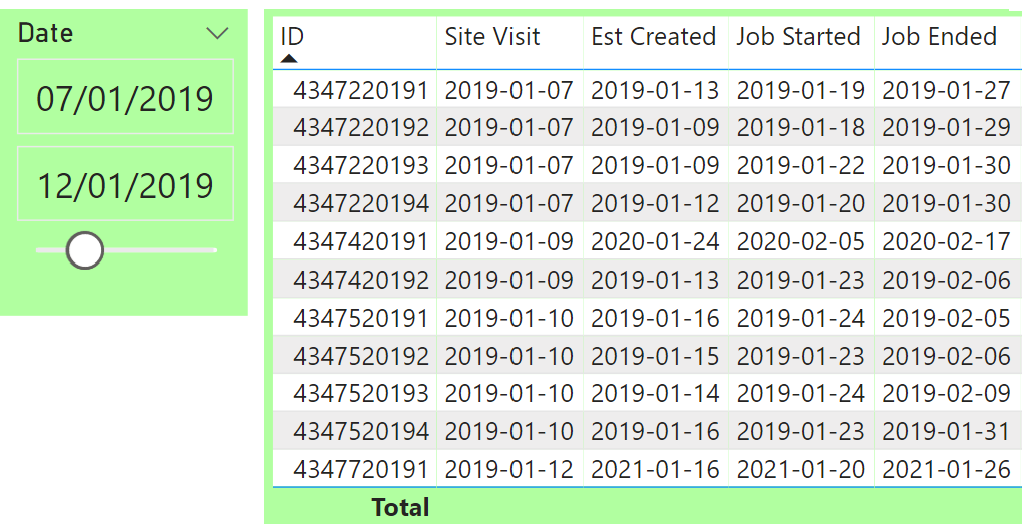
Visual
Slicer reduces viz to 11 rows. Measures I’ll create don’t require this viz but it helps to verify results.
Measures
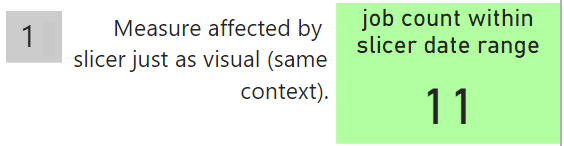
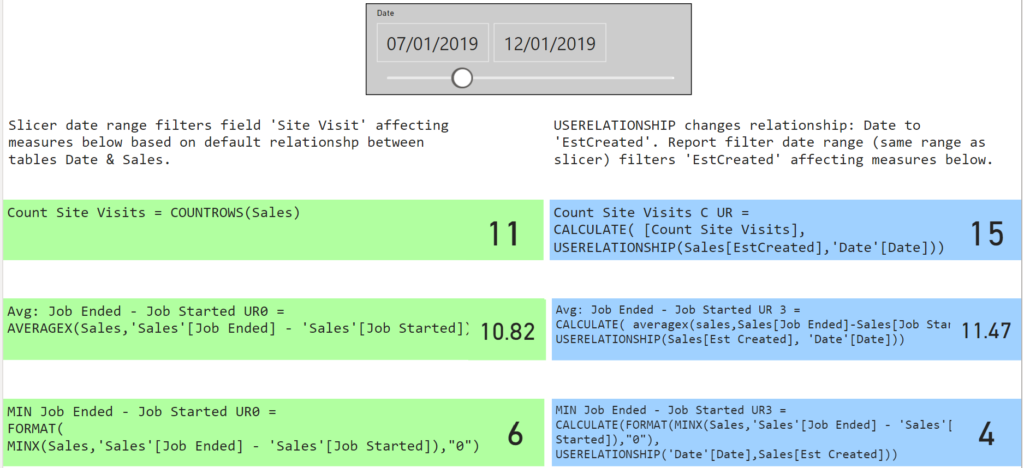
count site visits
Result of 11 depends on slicer Date range (just as viz above with 11 rows).
Count Site Visits = COUNTROWS(Sales)
Average: Job Ended – Job Started
Within slicer date range subtract [Job Started] from [Job Ended] and average them.
Avg: Job Ended - Job Started =
AVERAGEX(Sales,'Sales'[Job Ended] - 'Sales'[Job Started])

Minimum: Job Ended – Job Started
Within slicer date range what’s min number of days: Job Started to Job Ended?
MIN Job Ended - Job Started =
FORMAT(MINX(Sales,'Sales'[Job Ended] - 'Sales'[Job Started]),"0")
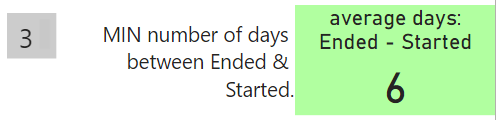
Had to wrap MINX with FORMAT function to display result as a number. Previous measure didn’t require this. There must be a reason but I haven’t found it.
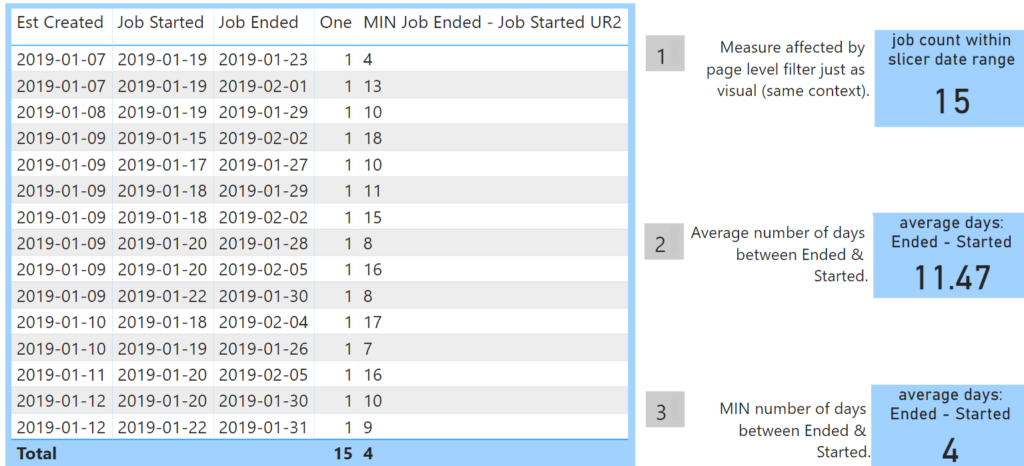
Viz Validates Measures
To test the measures, below on the right, I added a field and a measure to the viz.

Measures above depend on slicer date range. Below, measure name in bold:
- Count Site Visits: 11 jobs within slicer range
- Avg: Job Ended – Job Started: average days between Started & Ended
- MIN Job Ended – Job Started: minimum days between Started & Ended
Column One verifies row count as it’s aggregation = sum. Measure Count Site Visits also counts rows in table Sales based on current context.
Measure Avg: Job Ended – Job Ended in viz verifies results 10.82 (average) and 6 (min). A viz can’t always validate measures (DAX Studio is best).
USERELATIONSHIP
Concept
So far, measures work on rows where Site Visit dates are within slicer date range. Now I’ll create measures based on Est Created dates (instead of Site Visit).
Inactive Relationship
Only one relationship between tables can be active but I can add an inactive one. I dragged Date to Est Created. It defaults to inactive (dotted line).
Function
I’ll rebuild the same measures using USERELATIONSHIP to activate a temporary relationship between tables Sales & Date based on fields Est Created & Date.
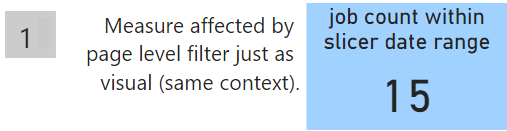
Page Filter
Instead of a slicer I used Page Filter: ‘Filters on this page’. Same date range as slicer.
count site visits
I reference existing measure Count Site Visits and add USERELATIONSHIP (listing fields to connect).
Count Site Visits C UR =
CALCULATE( [Count Site Visits],
USERELATIONSHIP(Sales[Est Created],'Date'[Date]))
Average: Job Ended – Job Started
Within ‘Filters on this page’ date range subtract [Job Started] from [Job Ended] and average them.
Avg: Job Ended - Job Started UR 2 =
CALCULATE( averagex(sales,Sales[Job Ended]-Sales[Job Started]),
USERELATIONSHIP(Sales[Est Created], 'Date'[Date]))

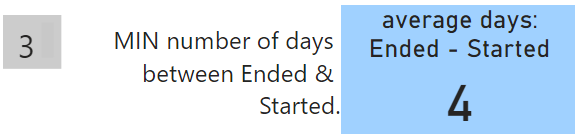
Minimum: Job Ended – Job Started
Within ‘Filters on this page’ range: [Job Ended] – [Job Started] and list min value.
MIN Job Ended - Job Started UR2 =
var calc = CALCULATE( MINX(sales, Sales[Job Ended]-Sales[Job Started])
,USERELATIONSHIP(Sales[Est Created],'Date'[Date]))
var final = format(calc, "0")
return
final
Viz Validates Measures
Same idea as before (viz validates measure results).
Compare Active & Inactive
Let’s compare the 2 sets of measures.
- Left(green): based on active (default) relationship
- Right(blue): based on inactive relationship (activated using USERELATIONSHIP)
Next one more twist: a time intelligence function adjusts slicer date forward 1 year.
Time Intelligence
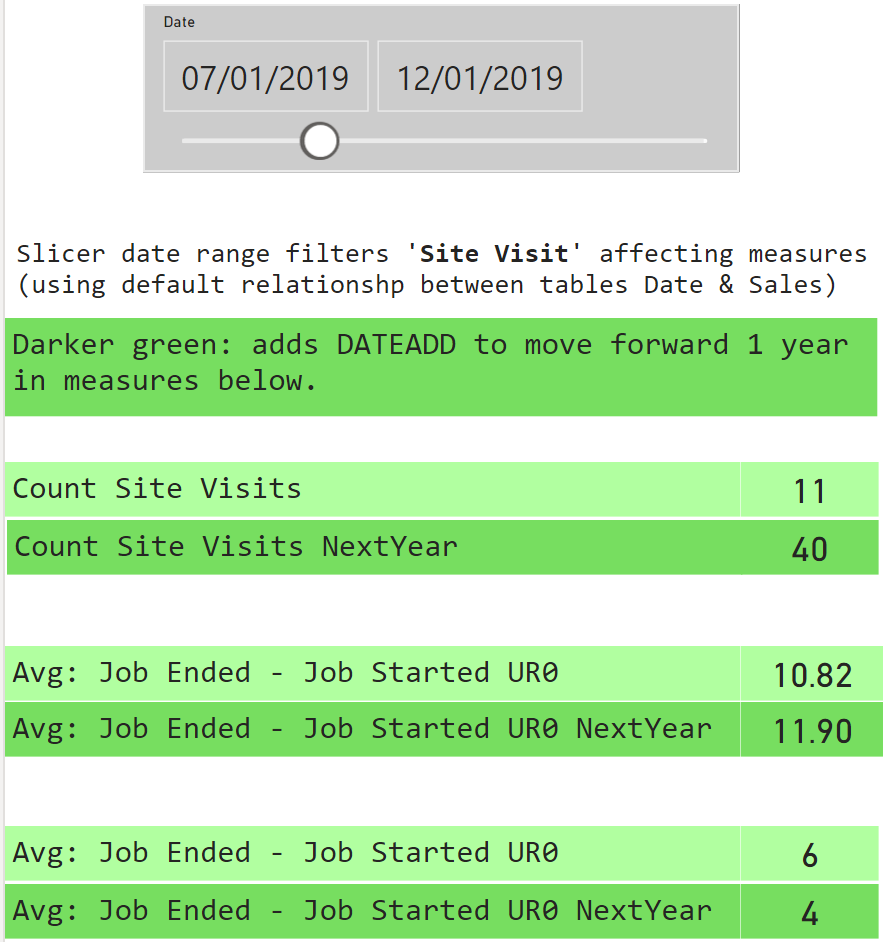
Date table enables time intelligence functions. Dark green/blue measures: year +1.
DATEADD (default)
Dark green measures use default relationship (Date & Site Visit) but also have CALCULATE & DATEADD (adds 1 year).
Below, DAX for the dark green measures:
Count Site Visits NextYear =
CALCULATE(
 COUNTROWS(Sales)
,DATEADD('Date'[Date],+1,YEAR))
Avg: Job Ended - Job Started UR0 Next Year =
CALCULATE(
AVERAGEX(Sales,'Sales'[Job Ended] - 'Sales'[Job Started])
,DATEADD('Date'[Date], +1,YEAR))
MIN Job Ended - Job Started Next Year =
CALCULATE(
FORMAT(MINX(Sales,'Sales'[Job Ended] - 'Sales'[Job Started]),"0")
,DATEADD('Date'[Date], +1, YEAR))
DATEADD (modified)
Dark blue measures use modified relationship (Date & Est Created) and also have CALCULATE & DATEADD (adds 1 year).

Dark blue measures are modified twice:
- relationship is between ‘Date’ and ‘Est Created’
- CALCULATE/DATEADD adds a year (2019 tp 2020)
Count Site Visits C UR NextYear =
CALCULATE( [Count Site Visits]
,DATEADD('Date'[Date],+1,YEAR)
,USERELATIONSHIP(Sales[Est Created],'Date'[Date]))
Avg: Job Ended - Job Started UR NextYear =
CALCULATE( averagex(sales,Sales[Job Ended]-Sales[Job Started])
,DATEADD('Date'[Date],+1,YEAR)
,USERELATIONSHIP(Sales[Est Created], 'Date'[Date]))
MIN Job Ended - Job Started UR2 Next Year =
var calc = CALCULATE( MINX(sales, Sales[Job Ended]-Sales[Job Started])
,DATEADD('Date'[Date],+1,YEAR)
,USERELATIONSHIP(Sales[Est Created],'Date'[Date]))
var final = format(calc, "0")
return
final
Recap
I’m glad that I practiced using functions USERELATIONSHIP and also CALCULATE & DATEADD. So powerful and important to know.
While creating the measures I realized that some of the results weren’t correct. I had to carefully figure out where I’d gone wrong. With a small dataset I was able to study the data in Excel and also use a visual to verify results. This won’t always be possible when developing large models. I should start using DAX Studio.