Slicer value dynamically changes the x axis on a chart.
Requirement
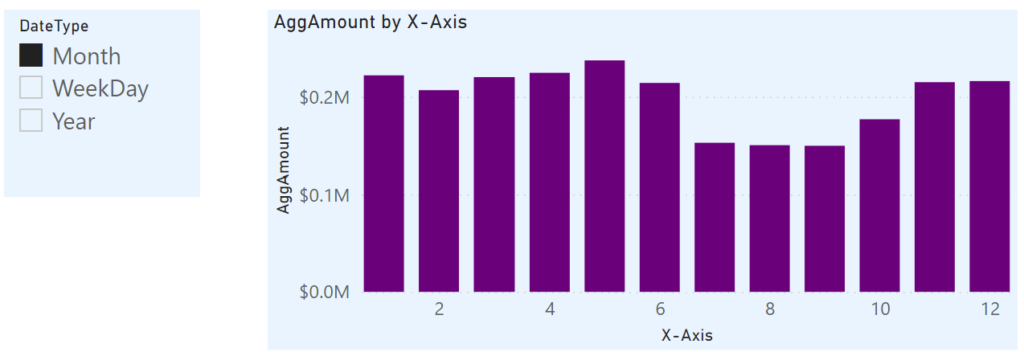
Selecting ‘Month’ in the slicer displays month values and amounts on x axis.
Selecting ‘WeekDay’ in the slicer displays weekday values and amounts on x axis.

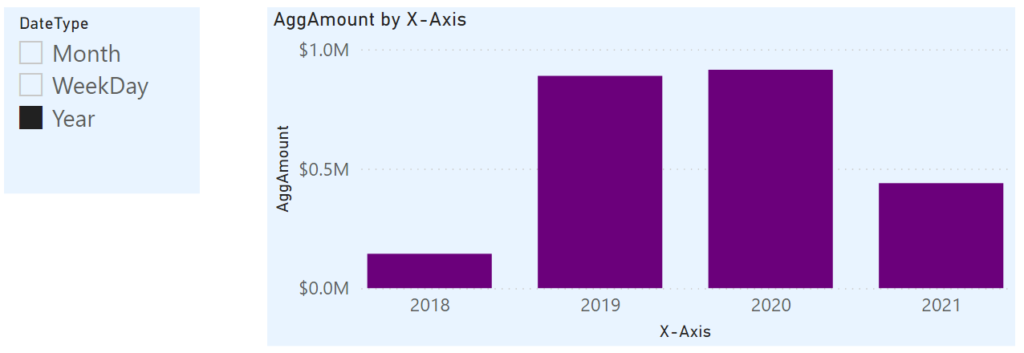
Selecting ‘Year’ in the slicer displays year values and amounts on x axis.
Files
Concepts
These concepts helped me get started:
- X axis values come from a column in a table (can’t be a measure)
- a slicer selection can’t be used in a table but it can filter visuals
I envisioned a solution like this:
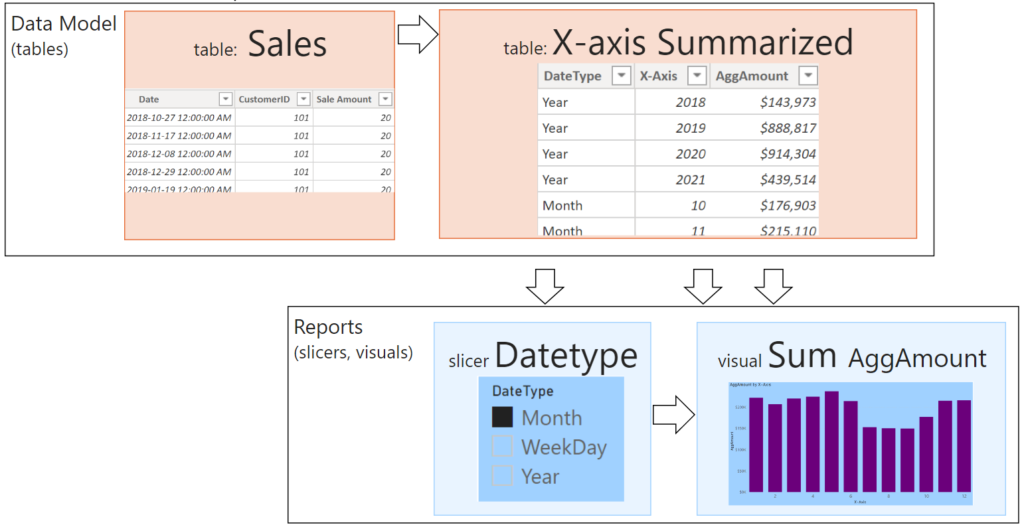
Slicer values from field DateType. As slicer = Month the viz x axis shows 1 to 12. Change to WeekDay to see 1 to 7. Viz sums field AggAmount.
How can I create table ‘X-axis Summarized’? On paper I drew a table with 3 columns and 3 groups of rows.
The table’s 3 columns. Column names & values:
- DateType – Month, WeekDay, Year
- X-axis – Month: 1 to 12, Quarter: 1 to 4, Year: 2018 to 2021
- AggAmount – aggregation of field Sale Amount (Table ‘Sales’)
The table’s 3 groups of rows:
- 12 rows for months
- 7 rows for weekday
- 4 rows for years
Solution
Final DAX Code
This DAX creates aggregated table ‘X-axis Summarized’ later used in slicer and viz:
X-axis Summarized =
UNION(
//YEAR ROWS
 SUMMARIZE(
   //ADD COLUMNS, NO AGGRETATION YET
   ADDCOLUMNS(Sales,"DateType","Year","X-Axis",YEAR(Sales[Date])),

   //SUMMARIZE ADDS THE AGGRETATION
   [X-Axis],[DateType],"AggAmount",SUM(Sales[Sale Amount])),

//MONTH ROWS
 SUMMARIZE(
   //ADD COLUMNS, NO AGGRETATION YET
   ADDCOLUMNS(Sales,"DateType","Month","X-Axis",MONTH(Sales[Date])),

   //SUMMARIZE ADDS THE AGGRETATION
   [X-Axis],[DateType],"AggAmount",SUM(Sales[Sale Amount])),

//WEEKDAY ROWS
 SUMMARIZE(
   //ADD COLUMNS, NO AGGRETATION YET
   ADDCOLUMNS(Sales,"DateType","WeekDay","X-Axis",WEEKDAY(Sales[Date])),

   //SUMMARIZE ADDS THE AGGRETATION
   [X-Axis],[DateType],"AggAmount",SUM(Sales[Sale Amount]))
)
Now I’ll review this step by step starting with creating rows for Year.
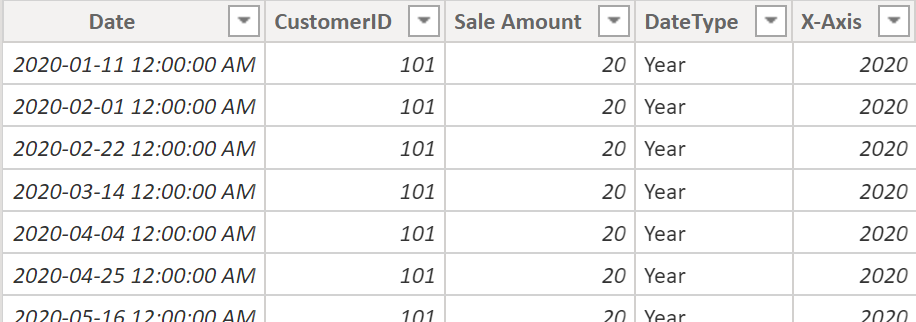
Step 1 Add Columns
ADDCOLUMNS creates a new table based on table Sales and adding new columns DateType and X-Axis. DateType repeats text “Year”, X-Axis extracts year from field Date. We still have 95176 rows just like referenced table Sales.
X-axis Summarized test =
ADDCOLUMNS(Sales,"DateType","Year","X-Axis",YEAR(Sales[Date]))
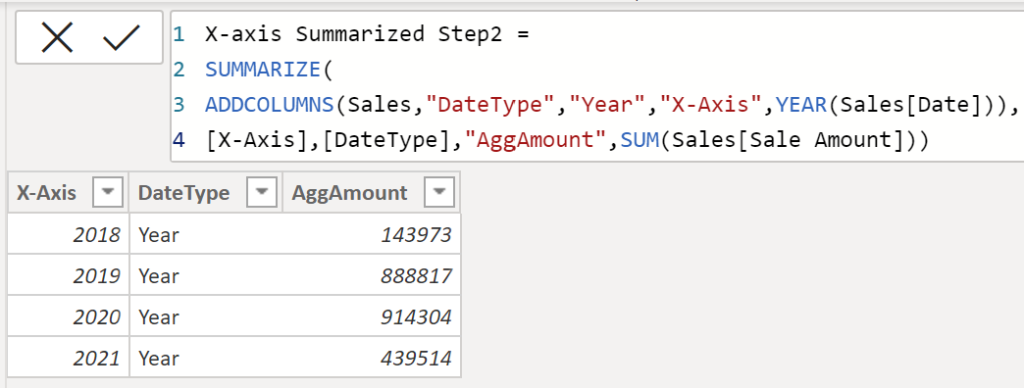
Step 2 Aggregate
Aggregate Step 1 rows by Year. SUMMARIZE function aggregates. ADDCOLUMNS creates table, group by X-Axis & DateType, sum Sale Amount.
X-axis Summarized Step2 =
SUMMARIZE(
ADDCOLUMNS(Sales,"DateType","Year","X-Axis",YEAR(Sales[Date])),
[X-Axis],[DateType],"AggAmount",SUM(Sales[Sale Amount]))
This creates 4 rows as we have years 2018, 2019, 2020, 2021.
Step 3 Union
Repeat Step 2 for Month and Weekday, stack all 3 using function UNION:
X-axis Summarized =
UNION(
//YEAR ROWS
 SUMMARIZE(
   ADDCOLUMNS(Sales,"DateType","Year","X-Axis",YEAR(Sales[Date])),
   [X-Axis],[DateType],"AggAmount",SUM(Sales[Sale Amount])),

//MONTH ROWS
 SUMMARIZE(
   ADDCOLUMNS(Sales,"DateType","Month","X-Axis",MONTH(Sales[Date])),
   [X-Axis],[DateType],"AggAmount",SUM(Sales[Sale Amount])),

//WEEKDAY ROWS
 SUMMARIZE(
   ADDCOLUMNS(Sales,"DateType","WeekDay","X-Axis",WEEKDAY(Sales[Date])),
   [X-Axis],[DateType],"AggAmount",SUM(Sales[Sale Amount]))
)
This final table could also be created using variables like this:
X-axis Summarized v2 =
//YEAR ROWS
 var yearrows =
 SUMMARIZE(
   ADDCOLUMNS(Sales,"DateType","Year","X-Axis",YEAR(Sales[Date])),
   [X-Axis],[DateType],"AggAmount",SUM(Sales[Sale Amount]))

//MONTH ROWS
var monthrows =
 SUMMARIZE(
   ADDCOLUMNS(Sales,"DateType","Month","X-Axis",MONTH(Sales[Date])),
   [X-Axis],[DateType],"AggAmount",SUM(Sales[Sale Amount]))

//WEEKDAY ROWS
var weekdayrows =
 SUMMARIZE(
   ADDCOLUMNS(Sales,"DateType","WeekDay","X-Axis",WEEKDAY(Sales[Date])),
   [X-Axis],[DateType],"AggAmount",SUM(Sales[Sale Amount]))

RETURN
UNION(yearrows, monthrows, weekdayrows)
Alternative Solution
I solved this without looking online. Later I was curious about other solutions. I finally found a solution from Radacad.com for the exact same requirement.
It’s an entirely different way to solve it. It combines these features:
- inactive relationships
- disconnected table
- function USERELATIONSHIP.
I highly recommend reviewing it.