Question 1 is easy. Question 2 is tricky. It requires a virtual summary group by table. A what?
Set-up
Each row in table fctSiteview is a person who visits a website on a day.
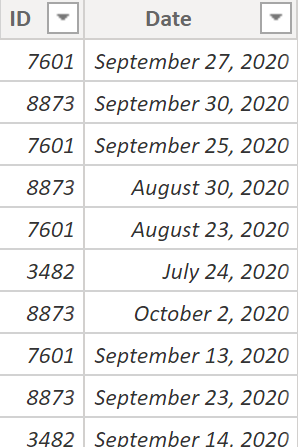
Table fctSiteview has 30 rows. We also have a date table called Date.
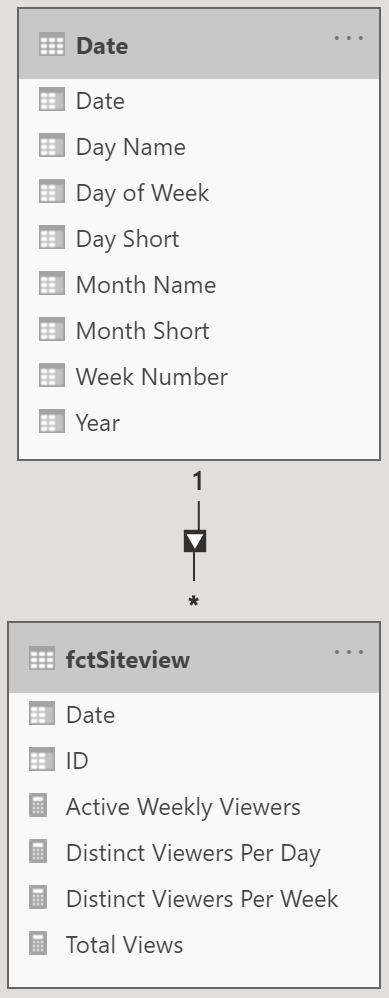
Table ‘Date’ is the 1 side and table ‘fctSiteview’ is the many side. Table ‘fctSiteview’ only has 2 columns: ‘Date’ & ‘ID’ but above you see some DAX measures that are stored in the table.
Questions
Question 1:
How many people per week have viewed the website?
Question 2:
How many people per week have >= 3 unique days with views?
Solution
Question 1 Solution
Drop WeekNum (from table Date) into viz, add measure ‘Distinct Viewers Per Week’. See ‘Summary’ section for more about table Date.
Distinct Viewers Per Week = DISTINCTCOUNT(fctSiteview[ID])

Question 2 Solution
Final measure and visual:
Active Weekly Viewers =
COUNTROWS(
    FILTER(
           SUMMARIZE('fctSiteview', fctSiteview[ID],'Date'[Week Number],
                                   "Dayx", DISTINCTCOUNT(fctSiteview[Date]))
           ),
           [Dayx] >=3
    )
)
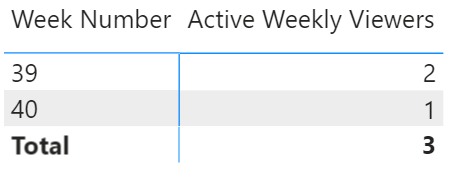
Measure ‘Active Weekly Viewers’ in our viz split by ‘Week Number’:
How does it work?
In table ‘fctSiteview’ each row is a person who viewed the website on a particular day. We can’t directly use this data. We want to count people (‘ID’) who viewed the site 3 or more distinct days per week (‘Week Number’).
SUMMARIZE function
The vital most inner part of the final measure:
SUMMARIZE('fctSiteview', fctSiteview[ID],'Date'[Week Number], "Dayx", DISTINCTCOUNT(fctSiteview[Date])))
We get a distinct date count grouped by ‘ID’ & ‘Week Number’. It’s not a physical table it’s virtual! It relies on CPU and doesn’t take up any space.
FILTER function
Wrap SUMMARIZE results with FILTER to exclude those with less than 3 unique days per week:
FILTER(
           SUMMARIZE('fctSiteview', fctSiteview[ID],'Date'[Week Number],
                                   "Dayx", DISTINCTCOUNT(fctSiteview[Date]))
           ),
           [Dayx] >=3
)
COUNTROWS function
COUNTROWS gives us a single number. In the viz, ‘Week Number’ is in the row area so our ‘Active Weekly Viewers’ measure runs for each ‘Week Number’.
COUNTROWS(
    FILTER(
           SUMMARIZE('fctSiteview', fctSiteview[ID],'Date'[Week Number],
                                   "Dayx", DISTINCTCOUNT(fctSiteview[Date]))
           ),
           [Dayx] >=3
    )
)
Downside of virtual table: we can’t see the data!
For educational purposes let’s use DAX to create a physical table to see the data. Be careful: creating physical tables increases file size.
On ribbon click ‘Modeling’ & ‘New Table’. Paste in the DAX below:
zSummary = SUMMARIZE('fctSiteview', fctSiteview[ID],'Date'[Week Number], "Dayx", DISTINCTCOUNT(fctSiteview[Date])))
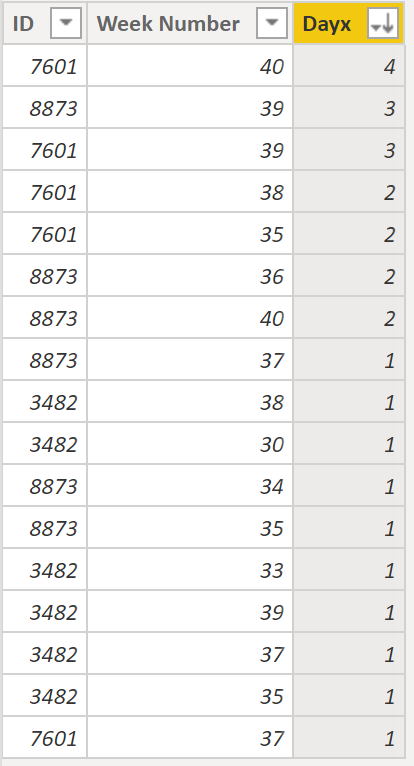
Above is wrapped with FILTER function to exclude rows with less than 3. I created another table using this DAX to show the remaining rows:
zSummaryFilter =
FILTER(
               SUMMARIZE('fctSiteview', fctSiteview[ID],'Date'[Week Number],
                                        "Dayx", DISTINCTCOUNT(fctSiteview[Date]))
               ),
[Dayx]>=3)
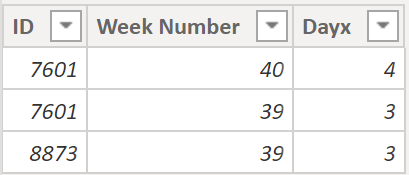
Now we see that COUNTROWS function counts 3 rows. Final viz shows 2 for week 39 and 1 for week 40.
Summary
Why a Date Table?
Column WeekNum is from table Date. Why not add a helper column in table Siteview to calculate week number?
It’s best practice to add a date table with all relevant date columns (eg Year, Month, WeekNumber, etc). Why? It’s more efficient to use date table (a dimension table) columns in slicers and filters compared to using unique values from potentially very large fact tables (like table Siteview).
If you’re still thinking: “Why not just put everything in one table?” there are times when we might make an exception and do this but for large models it’s essential to split your data into fact tables and dimension tables. A fact table lists transactions or purchases. A dimension table is shorter and wider with various columns that further describe a single column in a fact table (eg ‘Date’ or ‘Customer’).
Why a Virtual Table?
As mentioned above, using DAX to create physical data can at times be helpful but it will increase the file size. Using a function like SUMMARIZE to create a virtual table inside a measure is usually a better option.
About Me
One way to endure the covid crisis is keep busy. So in this blog I’ll keep practicing POWER BI (Power Query and DAX mostly).