Create a 2nd slicer based on non selected values from 1st slicer.
Requirement
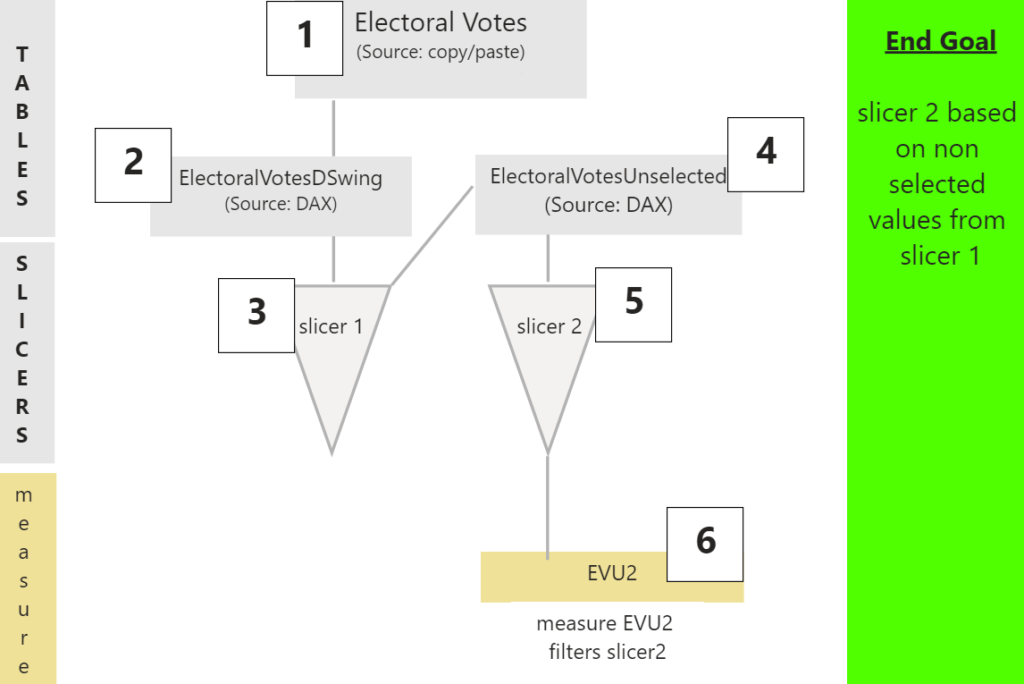
Slicer #1 has a list of U.S. states. In Slicer #2 display states that are not selected in Slicer #1

Files: Pbix
Below is zipped Pbix file:
Key Measure
Measure EVU2 is used as a filter on slicer #2!
EVU2 =
//counts base table swing states (used in _final to check if empty)
VAR _countbaseF = FILTER(ElectoralVotes,ElectoralVotes[RepDem] = "Swing")
VAR _countbaseC = COUNTROWS(_countbaseF)

//dem swing states: harvest them, count them
VAR _harvestDSwing =  VALUES(ElectoralVotesDSwing[State])
VAR _countDSwing = COUNTROWS(_harvestDSwing)

//Magic Below!
VAR _MB = CALCULATE(
         COUNTROWS(ElectoralVotesUnselected),
         EXCEPT(ElectoralVotesUnselected, _harvestDSwing))

//if Dem swing slicer = empty then show all else _MB
VAR _final = IF(_countbaseC-_countDSwing=0,1, _MB)

RETURN
_final
Set-up
Concept
Manually changing Swing to Rep or Dem in table ElectoralVotes (via power query) is tedious. I wanted a quicker way.
Note: there are a few flaws to my solution I discuss at end of post.
Raw Data & Slicers
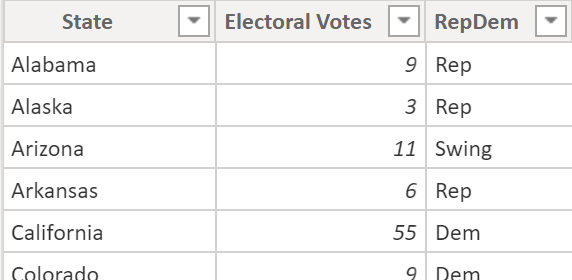
1) Table: ElectoralVotes
Base table with all states (strong Rep/Dem states and Swing states).
2) Table: ElectoralVotesDSwing
Add table using DAX to display only Swing states from table ElectoralVotes.
ElectoralVotesDSwing = FILTER(ElectoralVotes,ElectoralVotes[RepDem] = "Swing")
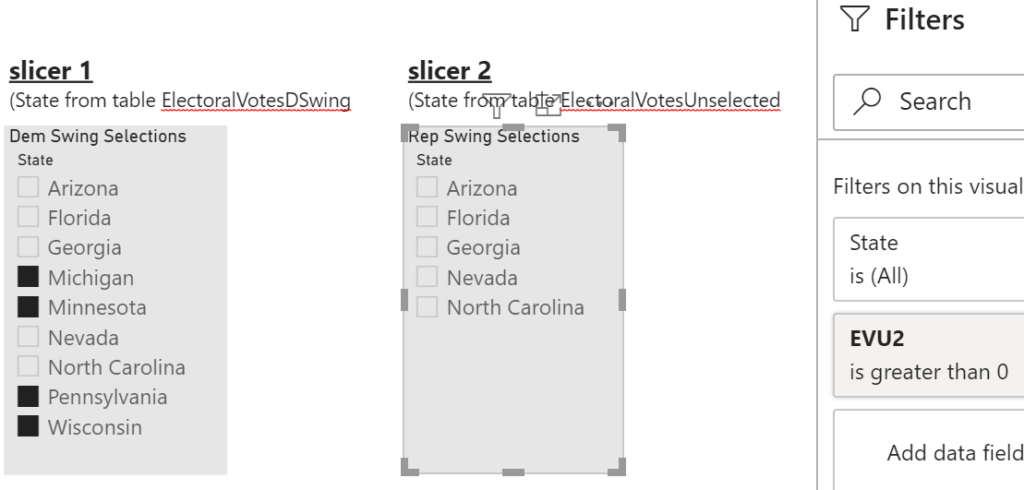
3) Slicer #1: State (ElectoralVotesDSwing)
Slicer #1 uses column State from table ElectoralVotesDSwing above. Used for assigning swing states to democrats.
4) Table: ElectoralVotesUnselected
Another table created using DAX. It has only 1 column called State.
ElectoralVotesUnselected =
VAR _harvestSwDemAS = ALLSELECTED(ElectoralVotesDSwing[State]) //harvest democrat slicer selections
RETURN
_harvestSwDemAS
5) Slicer #2: State (ElectoralVotesUnselected)
Slicer #2 (highlighted) only works when measure EVU2 filters it!
Huh? It’s tricky. Let’s examine measure EVU2
Solution
6) Measure: EVU2
Let’s review EVU2. Remember: measure EVU2 is used to filter slicer #2.
EVU2 =
//counts base table swing states (used in _final to check if empty)
VAR _countbaseF = FILTER(ElectoralVotes,ElectoralVotes[RepDem] = "Swing")
VAR _countbaseC = COUNTROWS(_countbaseF)

//dem swing states: harvest them, count them
VAR _harvestDSwing =  VALUES(ElectoralVotesDSwing[State])
VAR _countDSwing = COUNTROWS(_harvestDSwing)

//Magic Below!
VAR _MB = CALCULATE(
         COUNTROWS(ElectoralVotesUnselected),
         EXCEPT(ElectoralVotesUnselected, _harvestDSwing))

//if Dem swing slicer = empty then show all else _MB
VAR _final = IF(_countbaseC-_countDSwing=0,1, _MB)

RETURN
_final
Key Variable: _MB
//Magic Below!
VAR _MB = CALCULATE(
         COUNTROWS(ElectoralVotesUnselected),
         EXCEPT(ElectoralVotesUnselected, _harvestDSwing))
This is the brain of measure EVU2.
dax.guide defines EXCEPT function as: “Returns the rows of left-side table which do not appear in right-side table.“
ElectoralVotesUnselected (left-side table) a single column table and variable _harvestDSwing uses VALUES function to create a table from ElectoralVotesDSwing[State] (right-side table).
Inside CALCULATE the EXCEPT function reduces rows. COUNTROWS is the expression. It displays a 1 for all qualifying rows due to >0 filter condition (look in ‘Filters’ section).
Variable _final
//if Dem swing slicer = empty then show all else _MB
VAR _final = IF(_countbaseC-_countDSwing=0,1, _MB)
Variable _MB is the brain but the solution doesn’t work without the IF function in variable _final. Why?
I can use variable _MB directly without variable _final unless slicer #1 has no selections. When slicer #1 has no states selected slicer #2 is empty.
The IF function inside _final checks for this and returns a 1 for everything (so all swing states appear in slicer #2). If false, meaning there’s at least 1 selection in slicer #1, then we use variable _MB.
Measure Testing
EVU2 is my final measure but it took a ton of experimenting to get there. In my pbix file report ‘testing’ uses several test measures: EVU2TestingDem, EVU2Testing, etc. WHY?
When measure EVU2 was mostly working I didn’t want to add another component but break a previously working part. So I would make a copy it and experiment on that in report ‘testing’. When I got confused I could simply discard it.
In EVU2Testing below I could choose which variable to display (to see what was inside it). Below I added “//” in front of _final to turn it into a comment. The measure displays results from _showDSwing.
EVU2Testing =
//counts base table swing states (used in _final to check if empty)
VAR _countbaseF = FILTER(ElectoralVotes,ElectoralVotes[RepDem] = "Swing")
VAR _countbaseC = COUNTROWS(_countbaseF)

//dem swing states: harvest them, show them, count them
VAR _harvestDSwing =  values(ElectoralVotesDSwing[State])
VAR _showDSwing = CONCATENATEX(values(ElectoralVotesDSwing[State]),[State],", ")
VAR _countDSwing = COUNTROWS(_harvestDSwing)

//Magic Below!
VAR _MB = CALCULATE(
         COUNTROWS(ElectoralVotesUnselected),
         EXCEPT(ElectoralVotesUnselected, _harvestDSwing)
         )

//if Dem swing slicer = empty then show all else _MB
VAR _final = IF(_countbaseC-_countDSwing=0,1, _MB)

RETURN
//_countbaseC
//_harvestDSwing
_showDSwing
//_countDSwing
//_harvestDSwingCount
//_final
Flaws & Alerts
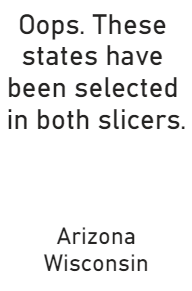
Flaw 1: I can select a Dem Swing State (Slicer 1) that’s already been selected in Rep Swing (Slicer 2). Can we restrict it both ways?
Flaw 2: If I select states in slicer 1, then select states in slicer 2, then clear slicer 1 the selections in slicer 2 are still visible. Is this a flaw?
Alert Message: here are 2 measures that display selection errors. In report ‘Final visual’ EVU2BOTHcount and EVU2BOTH display a message when a swing state has been selected in both slicers.
Summary
This post was inspired by the 2020 U.S. election. The networks had all kinds of fancy interactive dashboards. I was curious about the various scenarios that would determine the outcome.
Manually changing swing states back and forth between Democrat and Republican was slow and tedious and I wanted to explore ideas and learn more about DAX and Power BI in the process. It definitely wasn’t easy but I did learn a lot.
Watching videos and reading books is definitely important but building something is the only way to practice.