Why did I struggle to transpose & unpivot data in power query? I missed a couple of key concepts. I need to practice!
Files: Excel & PBIX
Requirement
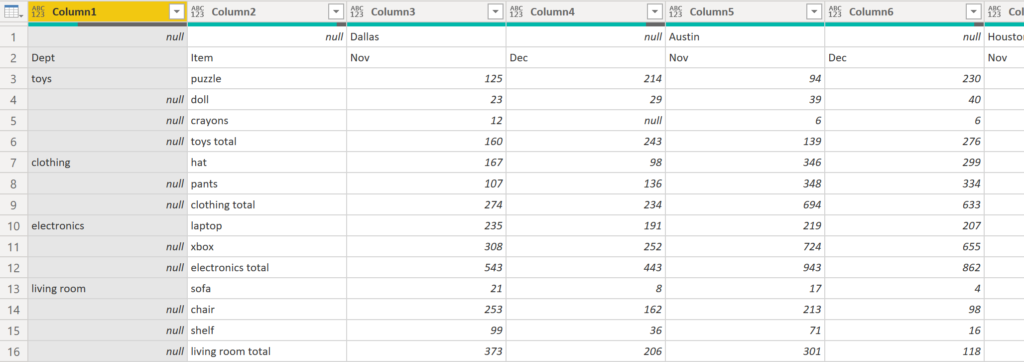
This is the data in Excel:
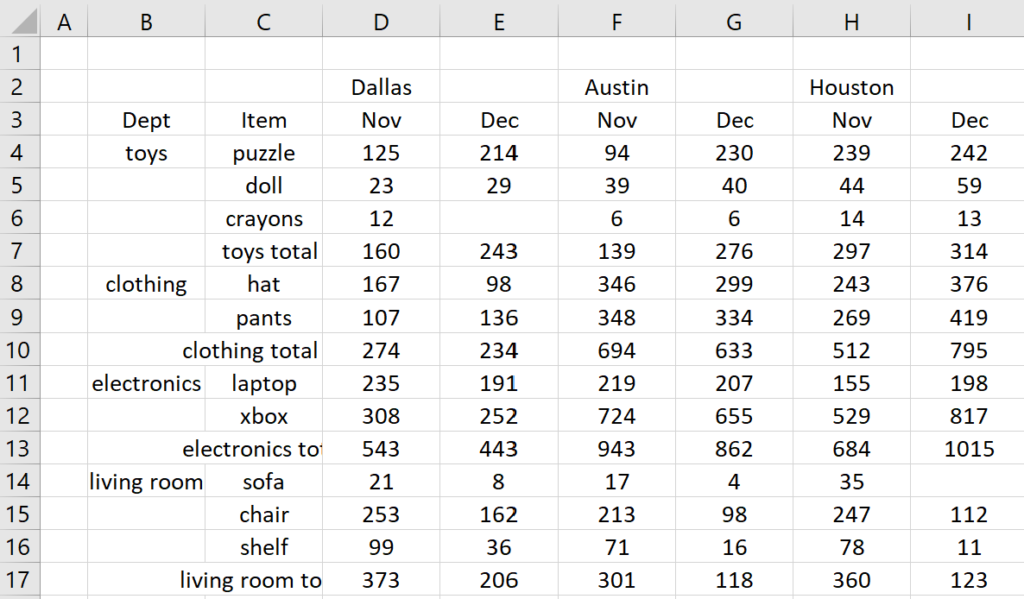
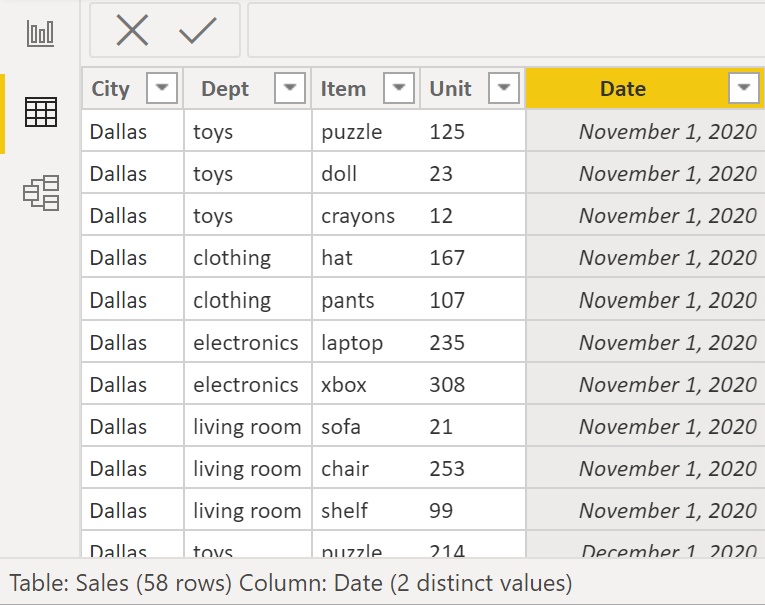
Rearrange it in power query and load it into PBI data model as a table like this:
Details
Sometimes I create a solution on the fly based on steps in my head. This time I struggled. I should’ve slowed down to focus on the details and then created a plan.
Things
How many things (entities) are there?
There are 5:
- Dept
- Item
- City
- Month
- Unit
My final query, that will become a data model table, should have 5 columns.
Rows
How many rows should I end up with?
- there are 4 unnecessary total rows (eg toys total)
- there are 2 blanks (nulls)
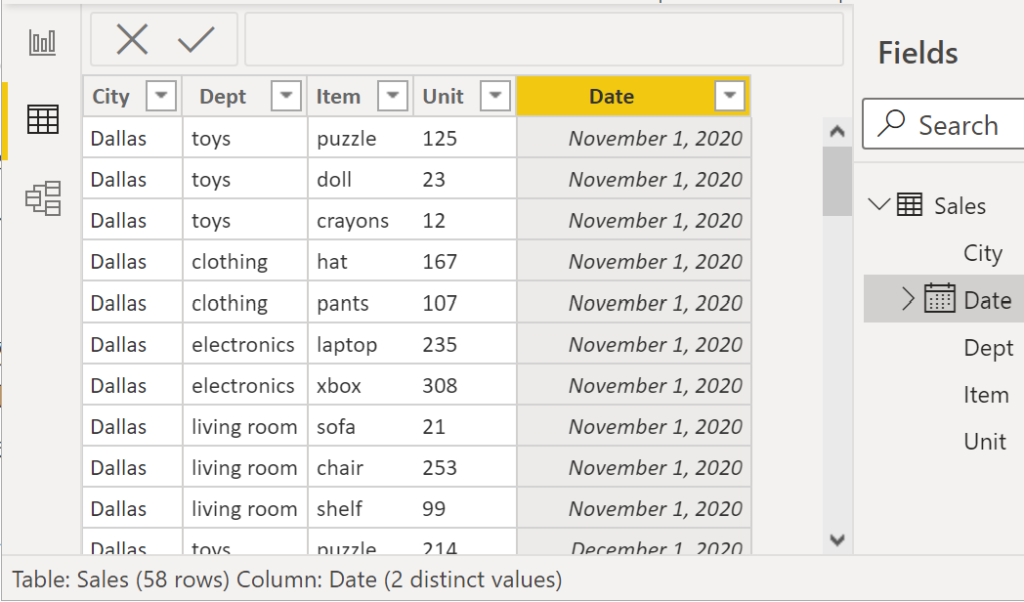
So, the table should have 58 rows as 58 numbers remain.
Layout
Can I quickly transpose this and watch Seinfeld reruns? No. Why not?
Columns B & C are in the correct form but columns in rows 2 & 3 (City & Month) aren’t. If I transpose then I’m fixing one thing and breaking another.
Imagine rotating it to the left but with the bottom 2 rows on top.
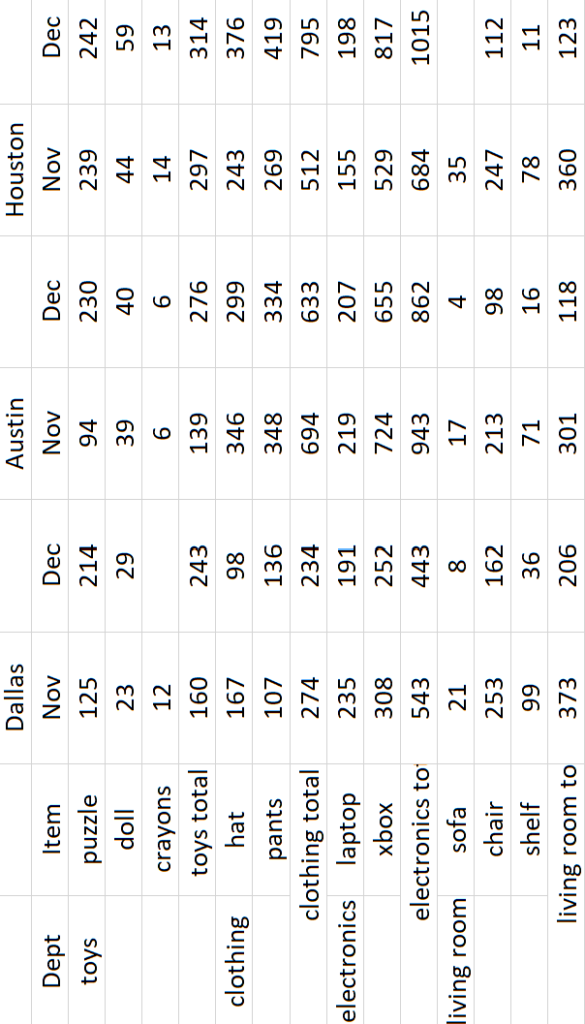
I’ve still got 2 vertical columns and 2 horizontal columns. What now?
Concept
Before I rotate it I need to merge the good guys, Dept & Item, into a single column so I won’t have the many to many problem. I’ll split them back into 2 columns later.
Solution
Load Excel Data
Load excel data into power query. Note: cities were promoted to column headers. I’ll remove this step as I need City values to move around in future steps (not be stuck as column headers).

Remove Auto-Generated Steps
I’ll remove auto generated steps Promoted Headers & Changed Type.
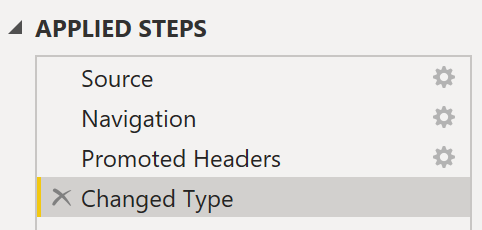
Now I have layout below and I can start adding transformation steps:
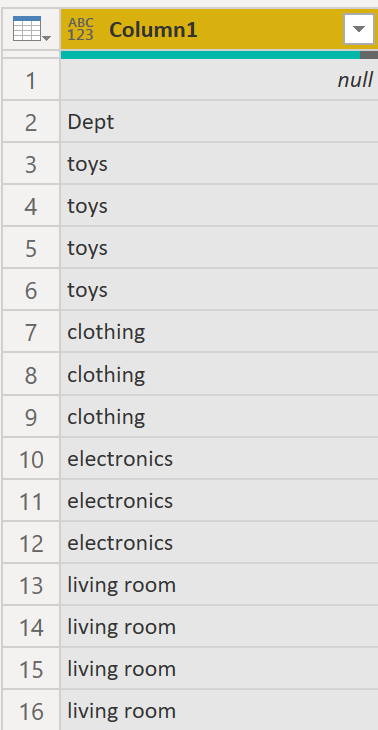
Fill Down Dept
- right click Column1
- fill
- down
Merge the good guys
Merge columns ‘Dept’ & ‘Item’:
- highlight column 1 & 2
- right click and merge (select a delimiter)
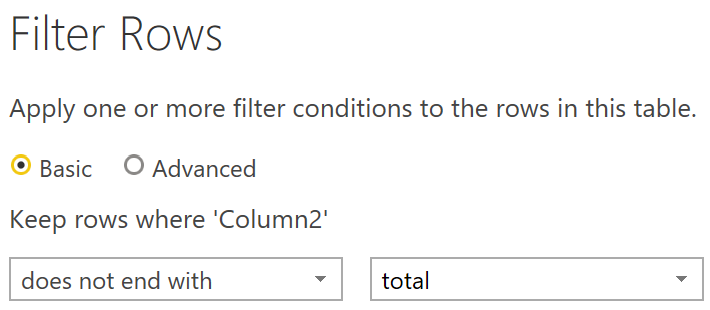
Remove Total Rows
In column Merged:
- click filter (beside header)
- text filters
- does not end with “total”
Now it’s starting to look better:
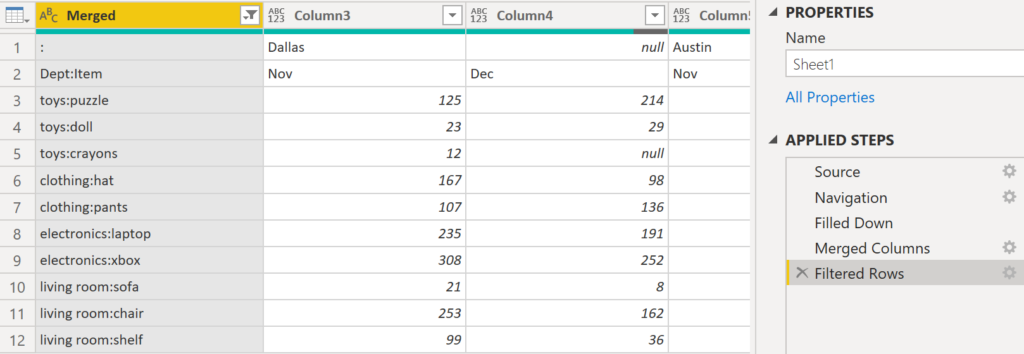
Transpose
After step merge, layout is 1 vertical X 2 horizontal (City & Month as rows). I can transpose, fill down City, unpivot etc.

Fill Down City
- right click Column1
- fill
- down
Promoted Headers
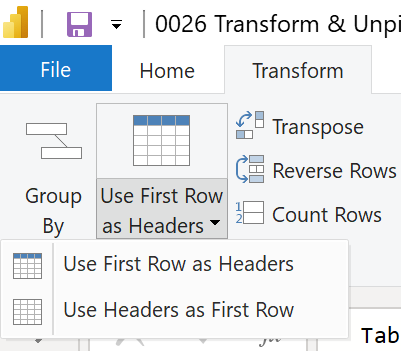
If I unpivot now it won’t work. First, I need to promote 1st row as headers.
- click Transform tab at top
- click ‘Use First Row as Headers’
Unpivot Other Columns
City & Month are vertical, headers are promoted. I’m ready to unpivot:
- highlight left most 2 columns (City & Month)
- right click
- unpivot other columns
It’s starting to look better now:

Split Column
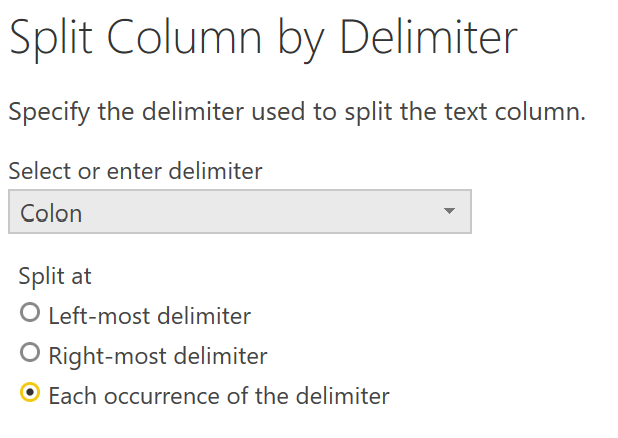
Now it’s time to split column Attribute back into separate columns:
- highlight column Attribute
- right click, split column by delimiter
- ensure Colon is selected and press ‘Ok’
I see that I have 5 columns and 58 rows as expected:

Rename Columns, Define Datatypes
I did all column renaming as a single step. Now I have the issue of 3 letter months. How can I convert them to dates?
I found this M code from Matt Allington (Power BI community). To work with US settings I modified it to:
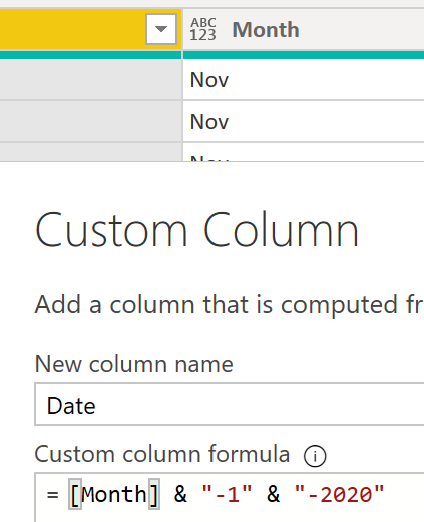
In this simple demo I hard coded year 2020 and day 1. I changed it to Date and other columns to datatype text.
Query to Data Model as Table
All this time I’ve been in Power Query making changes to query sheet1. Now, it’s time to load this query to Power BI’s data model (after I rename it to Sales). In ‘Queries [1]’ on the left side:
- rename query sheet1 to Sales
- right click Sales, enable load
- top left, Close & Apply
Finally, we have our data model table!
Final M Code
I did almost everything using the menus but it’s good practice to study the M code:
let
    Source = Excel.Workbook(File.Contents("C:\PBI local files\0026 Transform & Unpivot\0026 Transform & Unpivot x0.xlsx"), null, true),
    Sheet1_Sheet = Source{[Item="Sheet1",Kind="Sheet"]}[Data],
    #"Filled Down" = Table.FillDown(Sheet1_Sheet,{"Column1"}),
    #"Merged Columns" = Table.CombineColumns(#"Filled Down",{"Column1", "Column2"},Combiner.CombineTextByDelimiter(":", QuoteStyle.None),"Merged"),
    #"Filtered Rows" = Table.SelectRows(#"Merged Columns", each not Text.EndsWith([Merged], "total")),
    #"Transposed Table" = Table.Transpose(#"Filtered Rows"),
    #"Filled Down1" = Table.FillDown(#"Transposed Table",{"Column1"}),
    #"Promoted Headers" = Table.PromoteHeaders(#"Filled Down1", [PromoteAllScalars=true]),
    #"Unpivoted Other Columns" = Table.UnpivotOtherColumns(#"Promoted Headers", {":", "Dept:Item"}, "Attribute", "Value"),
    #"Split Column by Delimiter" = Table.SplitColumn(#"Unpivoted Other Columns", "Attribute", Splitter.SplitTextByDelimiter(":", QuoteStyle.Csv), {"Attribute.1", "Attribute.2"}),
    #"Renamed Columns" = Table.RenameColumns(#"Split Column by Delimiter",{{":", "City"}, {"Dept:Item", "Month"}, {"Attribute.1", "Dept"}, {"Attribute.2", "Item"}, {"Value", "Unit"}}),
    #"Added Custom" = Table.AddColumn(#"Renamed Columns", "Date", each [Month] & "-1" & "-2020"),
    #"Changed Type" = Table.TransformColumnTypes(#"Added Custom",{{"Date", type date}}),
    #"Reordered Columns" = Table.ReorderColumns(#"Changed Type",{"City", "Month", "Dept", "Item", "Date", "Unit"}),
    #"Removed Columns" = Table.RemoveColumns(#"Reordered Columns",{"Month"})
in
    #"Removed Columns"
I could/should have added comments to separate the steps and possibly renamed steps. Maybe I’ll do that later.
Recap
Key Concepts
There are several key concepts to understand and some pitfalls to avoid along the way. Until I can visualize it in my head I don’t really understand something. Here’s the starting data again:
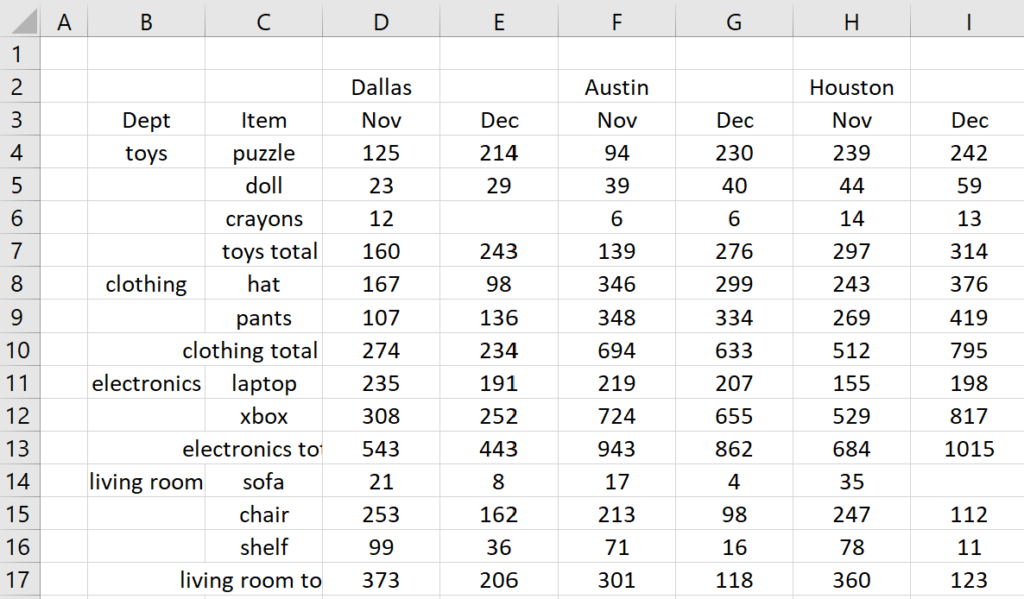
I omitted minor steps. These are the key concepts I can now see in my head:
- merge ‘Dept’ & ‘Item’ (all good guy columns become 1)
- rotate (transpose) 1 turn to the left (like a Rubix’s Cube)
- fill down City values
- promote headers (vital detail before unpivoting that I forgot!)
- unpivot other columns
- split step 1 back into 2 columns
Comments
There are endless messy data layouts. Here I had 2 good guy columns (already in correct vertical layout) and 2 columns flipped into rows. The next time it could be 4 and 6 or any combination.
A few weeks ago this layout stumped me but now I’ve practiced carefully. Will I remember this when it comes up again in the future? I hope so 🙂
I read somewhere that in some cases this approach may not work if the data is too large to transpose. If so, a more robust solution would be required.