Understanding the measure solution turned out to be more complex than I thought.
Requirement
Per State display largest individual Product Code aggregated sales amount.
Final Visual
California has 3 Product Codes. 944’s aggregated amount of 596 is the largest. For Oregon Product Code 358’s 183 amount is the largest.

Set-up
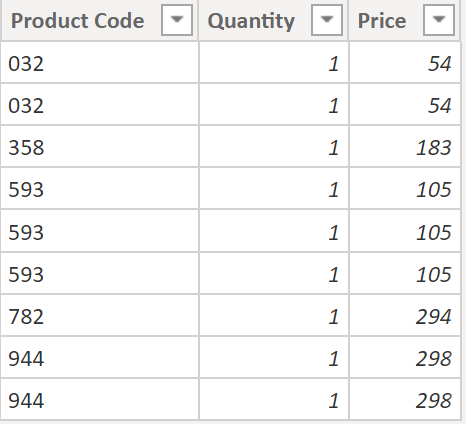
Table Sales
Each row is a sale of a product. Sales = Quantity X Price.
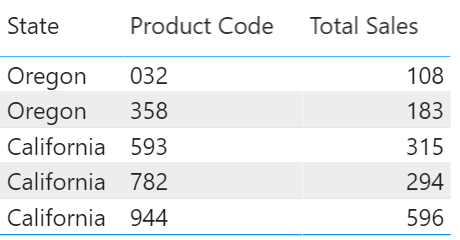
I can see that 596 is the largest aggregated amount (Product Code 944) but I need largest amount for each State in a 2 row viz.

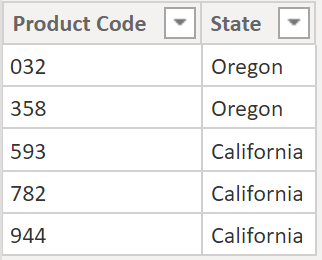
Table Product
‘State’ describes ‘Product Code’.
Final Measure
With State in the viz this measure solves it. How does it work?
Top Product Sales =
MAXX(
     'Product',
     CALCULATE(
               SUMX(Sales,
                    Sales[Quantity] * Sales[Price]
               )
     )
)
File: pbix
Solution Journey
I learned a lot from solutions that didn’t work before solving it.
Incorrect Solution 1
Oregon’s largest Product Code aggregated amount is 183. California’s is 596. But I want to display only the largest amount per State & Product Code (2 rows).
Total Sales = SUMX(Sales,Sales[Quantity] * Sales[Price])
I want to see this compact visual:

Incorrect Solution 2
Returns max single row non aggregated amount from Sales.
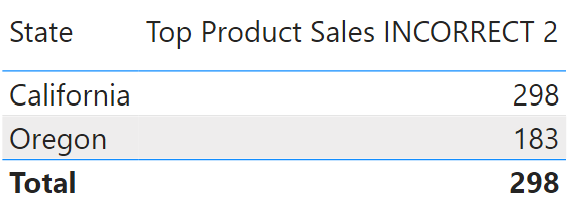
Top Product Sales INCORRECT 2 =
MAXX(
     Sales,
     Sales[Quantity] * Sales[Price])
Incorrect Solution 3
Aggregates only by ‘State’ NOT by both ‘State’ & ‘Product Code’. Why?
Top Product Sales INCORRECT 3 =
MAXX(
     'Product',
     SUMX(
          Sales,
          Sales[Quantity] * Sales[Price]
     )
)

Iterate table Product, aggregate Sales table for each ‘Product Code’, keep the max amount. Why didn’t this work?
Oregon’s 291 amount proves it didn’t give us the max aggregated amount per ‘Product Code’ (aggregates by ‘State’ only).
Oregon has Product Codes 032 (2 rows) and 358 (1 row).
1 * 183 (358) is larger than 1 * 54 + 1 * 54 (032) but SUMX ignored ‘Product Code’. MAXX sees 291 for Product Code 358 and 032.
Similarly for California each of the 3 Product Codes returns 596 and MAXX has no choice but to select 596.
Correct Solution
Once again here’s the measure that solves it:
Top Product Sales =
MAXX(
     'Product',
     CALCULATE(
               SUMX(Sales,
                    Sales[Quantity] * Sales[Price]
               )
     )
)
Difference between this and ‘Top Product Sales INCORRECT 3’? CALCULATE is wrapped around SUMX!
CALCULATE allows MAXX to see each aggregated amount per ‘Product Code’. This is Context Transition. Oregon MAXX sees 108 and 183. California MAXX sees 315, 294, and 596. MAXX sends 183 and 596 to the viz.
Another explanation: CALCULATE adds all ‘Product’ table fields to the filter context. Now, each ‘Product Code’ only sees it’s rows in Sales table.
The SUMX part could also be an independent measure that MAXX could reference. An implied CALCULATE is added when referencing an external measure.
Experiment
To prove what’s inside the final measure I changed MAXX to AVERAGEX. It proves that California’s 3 aggregated ‘Product Code’ amounts (315, 294, 596) are inside the measure! AVERAGEX uses all 3 of them to calculate 401.67 !

AVG Product Sales =
AVERAGEX(
     'Product',
     CALCULATE(
               SUMX(Sales,
                    Sales[Quantity] * Sales[Price]
               )
     )
)
Summary
Context Transition still boggles my mind but I’m slowly learning. Sometimes I can learn concepts from books and blogs directly but in this case I definitely had to spend hours experimenting with the measures in my pbix file.