Some questions require a virtual table inside a measure to create the required data structure.
Requirement
How many customers have purchased a product multiple times?
Several products have been purchased multiple times but we want to know how many customers have purchased each product more than once.
Set-up
This Power BI data model has three tables:
- Transaction
- Customer
- Product
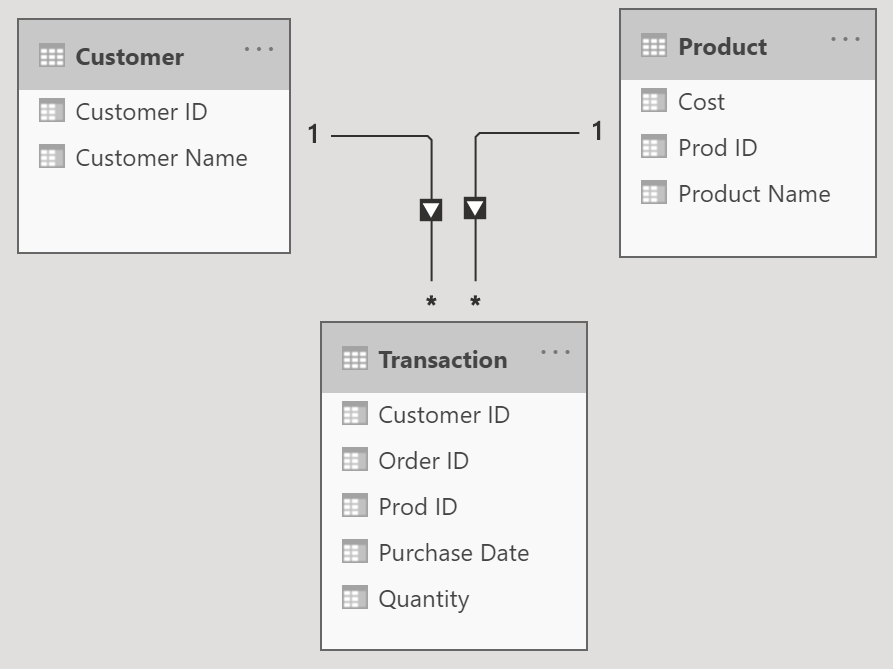
Below we see some of the 27 transactions.
Below we see the final viz. ‘Product Name’ is the filter context (no other filters or slicers) and my measure (I couldn’t think of a shorter name).
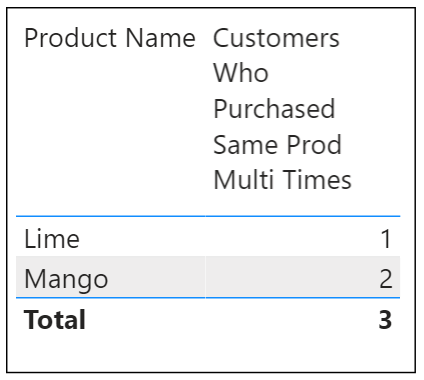
1 person (Zack) made 2 separate purchases of Lime. 2 people (Shawn & Deonna) each made 2 separate Mango purchases. No one else bought the same fruit more than once.
In the Total area the filter context for ‘Product Name’ is empty but I included ‘Product Name’ inside SUMMARIZE so we get 3. Had I not included ‘Product Name’ then the total would have returned 5!?
WHY? In the total row the filter context for ‘Product Name’ would be empty and anyone with >1 purchase (same or different fruit) would count.
Solution
DAX code
Customers Who Purchased Same Prod Multi Times =
COUNTROWS(
          FILTER(
                       SUMMARIZE('Transaction', 'Product'[Product Name],
                       Customer[Customer ID],"All Purchases",
                       COUNTROWS('Transaction')
                       ),
                       [All Purchases]>=2
          )
)
DAX details
Starting from the inside and going outwards:
- SUMMARIZE creates aggregated data. Grouping by Product Name and CustomerID and then counting their transactions
- Wrap it with FILTER to exclude product/customer combinations that have only 1 purchase
- For each ‘Product Name’ COUNTROWS counts remaining rows
Key: SUMMARIZE function does a group by and counts.
Why? Transaction table is based on individual transactions. We need to determine the total transaction count for each product/customer combination and only then filter out some rows.
The relationship between one side tables (Customer & Product) and many side table (Transaction) lets us to use all tables inside SUMMARIZE function.
See Virtual Table Rows
What rows are found in the virtual SUMMARIZE table? Let’s create a physical table to take a look. This is not a best practice because in a real model it could greatly increase the pbix file size.
On the ribbon click ‘Modeling’, ‘New Table’ and paste in DAX below:
test = SUMMARIZE('Transaction','Product'[Product Name],Customer[Customer ID],"All Purchases", COUNTROWS('Transaction'))
Below I sorted by column ‘All Purchases’. 2 customers have 2 different Mango purchases and 1 person has 2 different Lime purchases.

DAX Syntax Links
COUNTROWS https://dax.guide/countrows/
SUMMARIZE https://dax.guide/summarize/
FILTER https://dax.guide/filter/
About Me
This is my personal blog to practice learning Power BI (Power Query, DAX, etc) and share my knowledge with you.