I’m going to build a Funnel chart and recreate tooltip values using DAX measures.
Definition Funnel Chart
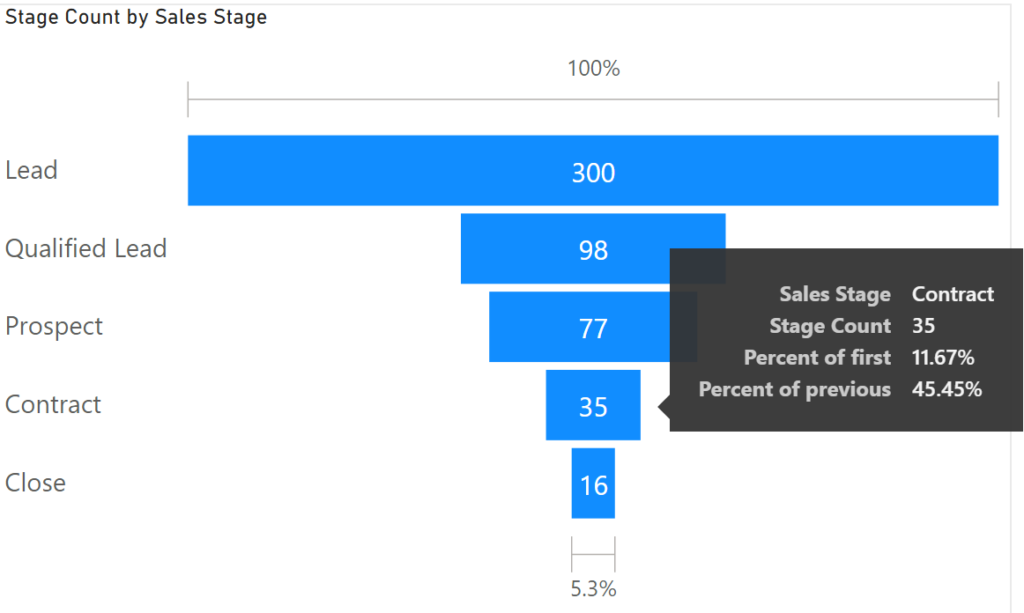
Visualize a linear process that has sequential steps. Eg a sales funnel to count customers. Each step is less than the previous step.
File: Pbix
Set-up
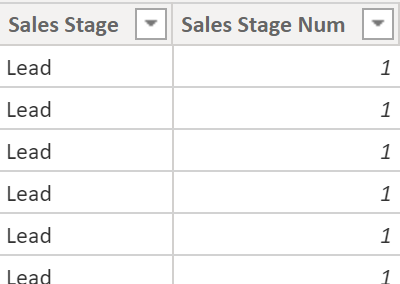
Table Funnel Chart has fields: ‘Sales Stage’ & ‘Sales Stage Num’.
‘Sales Stage’ contains text: Lead, Qualified Lead, Prospect, Contract, Close.
Lead contains a 1 in field ‘Sales Stage Num’, Qualified Lead a 2, etc.
Create Funnel Chart
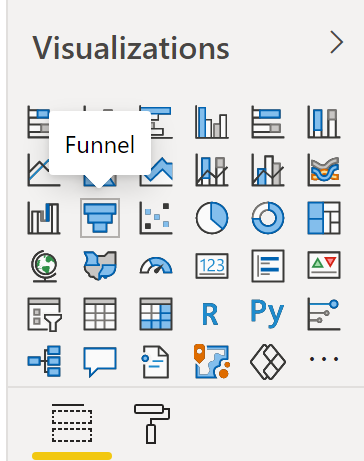
step 1 select Funnel viz type
step 2 add text field to group
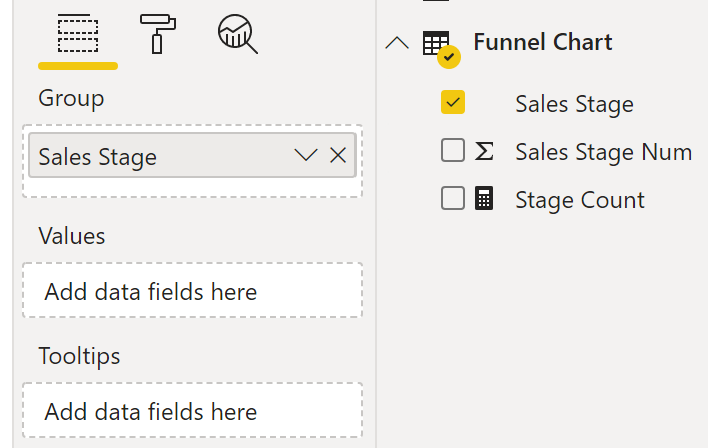
step 3 add measure to Values
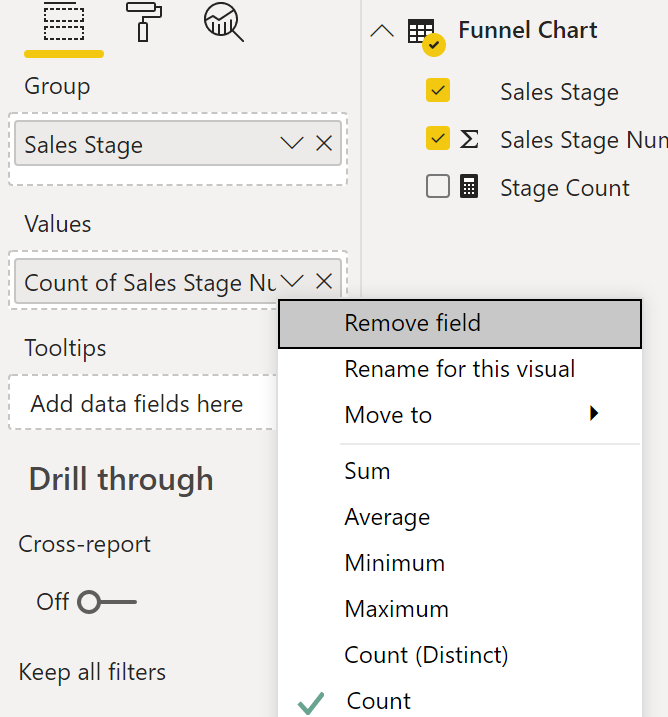
There’s 2 options for adding a measure to Values:
- drag ‘Sales Stage Num’ to Values. Ensure it’s set to Count
- create DAX measure (eg Stage Count), drag it to Values
Option1 implied measure (drag & drop). Option2 explicit measure via DAX:
Stage Count = COUNT('Funnel Chart'[Sales Stage Num])
Funnel Chart Tooltips
Hover over Prospect to see it’s values:
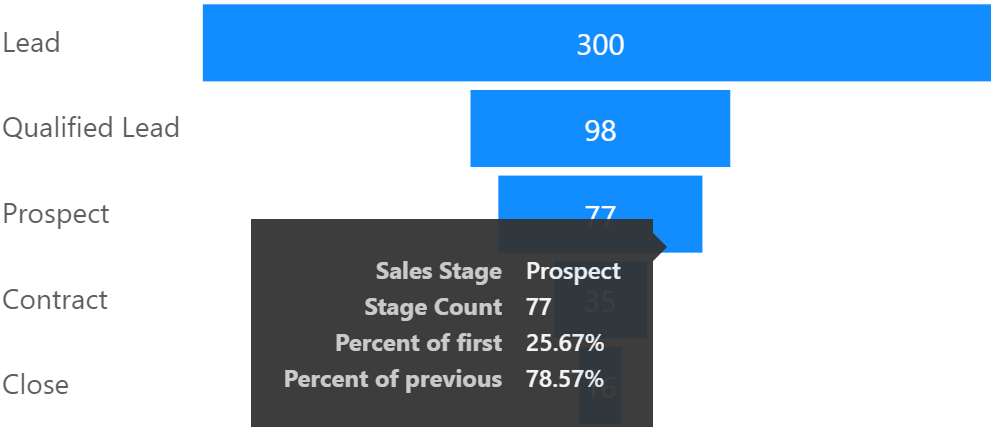
Visible Tooltip Values
Built-in tooltips are great but I have to hover over each point to see the numbers.
How can I see tooltip values for all stages? (see below)
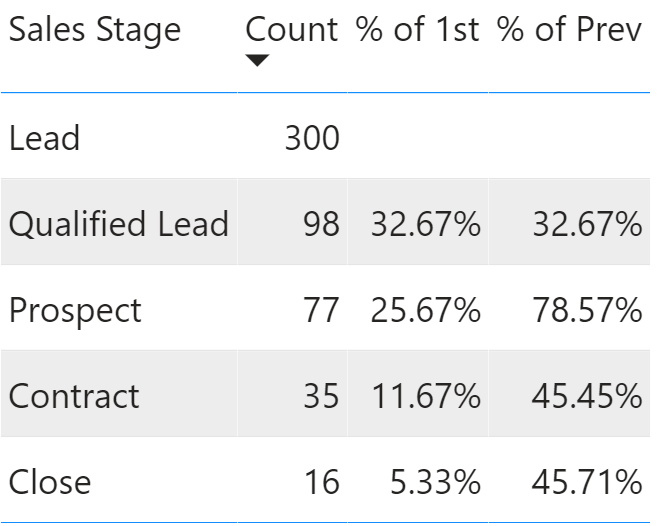
I’ll create tooltip values from scratch using DAX measures.
Stage Count
Renamed as ‘Count’ in this viz. Evaluated for each ‘Sales Stage’ value.
Stage Count = COUNT('Funnel Chart'[Sales Stage Num])
Percent of First
Here’s the final measure. Let’s examine each variable.
% of 1st =
//Calculate count (is split by viz filter context)
VAR ThisRowVal = COUNT('Funnel Chart'[Sales Stage Num])

//Get "Lead" stage count. CAN'T use var ThisRowVal
VAR LeadValue =
        CALCULATE(count('Funnel Chart'[Sales Stage Num]),
                  'Funnel Chart'[Sales Stage]="Lead")

//Get current stage value
VAR ThisStage = MIN('Funnel Chart'[Sales Stage Num])

//Final calculation
VAR FinalVal = IF(ThisStage = 1,BLANK(),
  DIVIDE(ThisRowVal,LeadValue))

RETURN
FinalVal
VAR ThisRowVal
Same as measure ‘Stage Count’ but I prefer to keep this internal (not reference measure). VAR ThisRowVal grabs ‘Sales Stage’ count for current ‘Sales Stage’ value.
VAR ThisRowVal = COUNT('Funnel Chart'[Sales Stage Num])
VAR LeadValue
We compare each ‘Sales Stage’ value to “Lead” value of 300.
VAR LeadValue =
        CALCULATE(count('Funnel Chart'[Sales Stage Num]),
                  'Funnel Chart'[Sales Stage]="Lead")
VAR ThisStage
Where am I? I need to know what row of the viz I’m on. Used next inside IF. ‘Sales Stage Num’ isn’t in the viz but it’s in the table.
VAR ThisStage = MIN('Funnel Chart'[Sales Stage Num])
VAR FinalVal
If I’m on row for “Lead” then show blank else divide the two variables.
VAR FinalVal = IF(ThisStage = 1,BLANK(),
  DIVIDE(ThisRowVal,LeadValue))
Percent of Prev
Here’s the final measure. Let’s examine each variable.
% of Prev =
//Get stage number (current viz row)
VAR ThisStage = MIN('Funnel Chart'[Sales Stage Num])
VAR PrevStage = ThisStage-1

//Count rows for current stage & prev stage
VAR ThisStageCount = COUNTROWS('Funnel Chart')
VAR LastStageCount =
    IF(ThisStage = 1, BLANK(),
    COUNTROWS(FILTER(ALL('Funnel Chart'),'Funnel Chart'[Sales Stage Num]=PrevStage)))

//Final division
VAR Final =
DIVIDE(ThisStageCount,LastStageCount)

RETURN
Final
VAR ThisStage
Once again, where am I? What row of the viz is it?
VAR ThisStage = MIN('Funnel Chart'[Sales Stage Num])
VAR PrevStage
And subtract 1 to get previous row’s ‘Sales Stage Num’.
VAR PrevStage = ThisStage-1
VAR ThisStageCount
Count the rows in the table (split by current ‘Sales Stage’).
VAR ThisStageCount = COUNTROWS('Funnel Chart')
VAR LastStageCount
Count rows in the table (split by previous ‘Sales Stage’). This time I include the IF here (show blank for top value ‘Lead’).
VAR LastStageCount =
    IF(ThisStage = 1, BLANK(),
    COUNTROWS(FILTER(ALL('Funnel Chart'),'Funnel Chart'[Sales Stage Num]=PrevStage)))
VAR Final
Dividing the two variables (numbers).
VAR Final =
DIVIDE(ThisStageCount,LastStageCount)
Summary
A basic Funnel Chart is easy to build but sometimes there are additional questions that require DAX 🙂
This was great practice to build. I got stuck at one point when writing the DAX and discovered a way to isolate my error. In my next post I’ll explain.