Initially the blank row is mysterious and annoying. I’ll explain how it happens and how to work with it.
File: Pbix
Download my pbix file and follow along:
Why a blank row?
In a viz you may see a blank row that doesn’t exist in the table.
Example: I add ‘Product Code’ (table Product) and measure ‘Total Sales’ to a viz. The blank row’s value is $270. We see 17 Product Codes.
Does the blank row exist in tables Product or Sales?
Product table has 1 column ‘Product Code’ (17 rows). No blank row. (normally Product table would have other columns describing the Products)
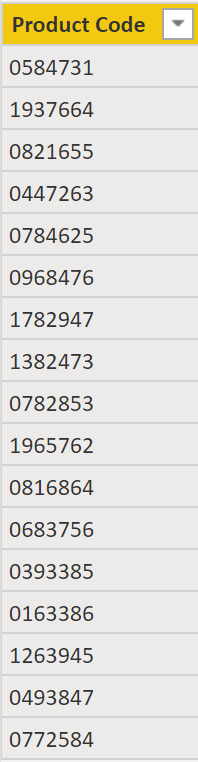
Table Sales has 2 fields and 90 rows. No blank row.
There’s no blank row in either table. Why does the viz have one?
Hint1: select the viz, remove the measure. The blank row disappears!
Blank row occurs when combining field ‘Product Code’ (table Product) and measure ‘Total Sales’ (sums ‘Sales Amount’ in table Sales). Why?
Hint2: What allows me to combine those fields in a viz? A relationship!
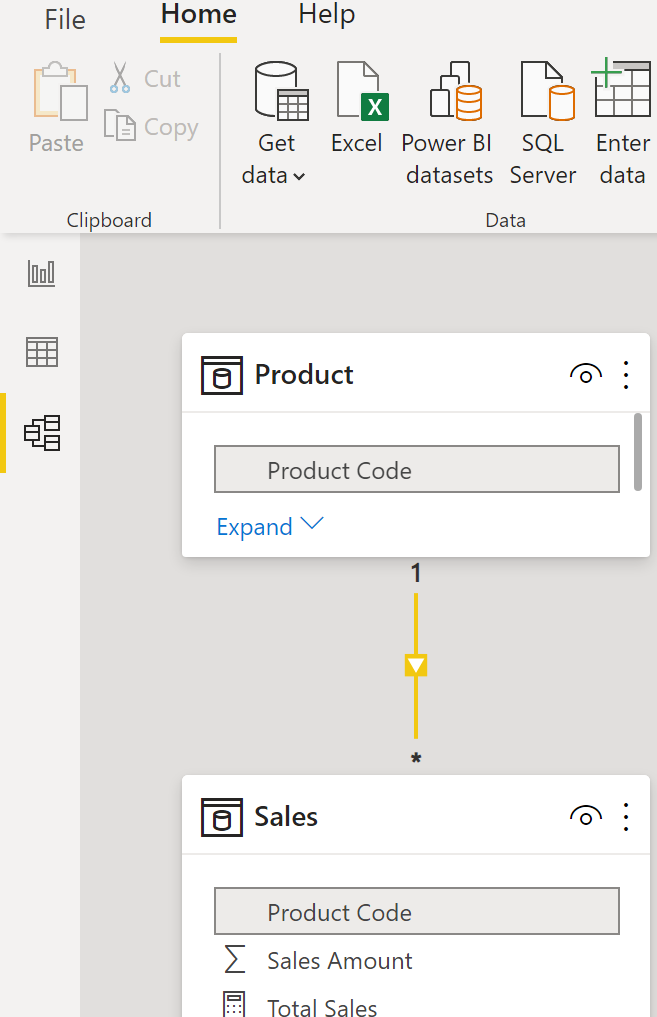
Both tables have a ‘Product Code’ used to create a relationship. Double click the vertical line between the tables to see this:

‘Product Code’ on the 1 side (Product) is a unique list. ‘Product Code’ on the many side (Sales) repeats each time the product is sold.
It’s possible a code in Product isn’t found in Sales (it has no sales) but all Product Codes from table Sales should be found in table Product!
Databases enforce referential integrity (don’t permit values on many side that are missing on one side). Power BI is different. It allows us to continue modeling but adds the blank row indicating there’s 1 or more missing IDs on the one side.
Count & Identify
We know why it happens but how can we:
- count missing IDs
- identify missing IDs
Count Missing IDs
I want to count Product Codes in Sales that aren’t in Product.
EXCEPT requires two tables. I used VALUES to create tables from single columns. COUNTROWS converts the table into a single value.
Blank Row ID Count =
VAR MissingIDs = EXCEPT(VALUES(Sales[Product Code]), VALUES('Product'[Product Code]))
RETURN
COUNTROWS(MissingIDs)
Identify Missing IDs
The variable is the same but now I use CONCATENATEX to combine codes into a single value. Note: if there are many missing codes it would be difficult to display them all.
Blank Row ID List =
VAR MissingIDs = EXCEPT(VALUES(Sales[Product Code]), VALUES('Product'[Product Code]))
RETURN
CONCATENATEX(MissingIDs,Sales[Product Code],", ")
VALUES vs DISTINCT
I dive into the difference between these functions (see pbix file).
Main point: VALUES function reads the relationship between tables Sales and Product and realizes that Sales has a Product Code that is missing in Product! Smart! DISTINCT function doesn’t do this.
Remove Product Table?
Why do I need Product table? Can’t I use Sale table’s ‘Product Code’?
It’s possible to do this for a quick analysis. This viz works but there are many reasons to model data properly.
Databases handle tons of data. Poorly designed models don’t work well (slow to run queries, require more physical space, can’t provide insights).
Modeling data into dimension and fact tables is extremely important. Why store redundant data in each fact table row when it can be kept in various dimension tables and joined to the fact table using a common field.
Proper modeling (Power Query: data clean-up, Data Model: relationships, calculated columns/tables, measures) is faster and delivers deeper insights. This is difficult if the data is dumped into one massive table.
Summary
Writing this post was great practice to cement the concepts. There’s no way to build models based only on theoretical knowledge (or worse no knowledge at all!). Practice Practice Practice 🙂
BTW, I used a filter in Power Query (on Product query) to filter out Product Code 0328475. I excluded two additional codes to ensure my measures were working (count/display multiple codes). I then changed it back to filter a single code.
I created ‘START’ report with bookmarks to other reports. I need to practice report/dashboard features but I seem to stick with M & DAX (so much to learn!).