My solution is based on function SUMMARIZECOLUMNS that creates a virtual table.
Requirement
How many customers have more than $10000 in total sales?
Files: Pbix & Excel
Final Measure
Count Customers with more than X in Sales =
COUNTROWS(
  FILTER(
       SUMMARIZECOLUMNS(Customer[ID],
                        "CustomerSales", SUM(Sales[Sales])
       ),
       [CustomerSales] > 10000
  )
)
Set-up
Raw Data
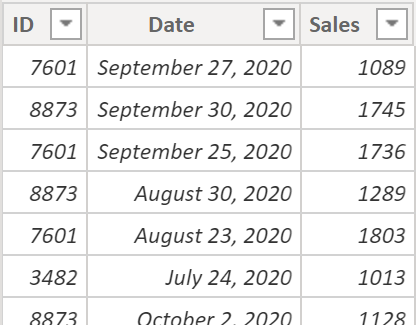
Each row is a sale to a customer (ID) on a particular date.
Table Relationships
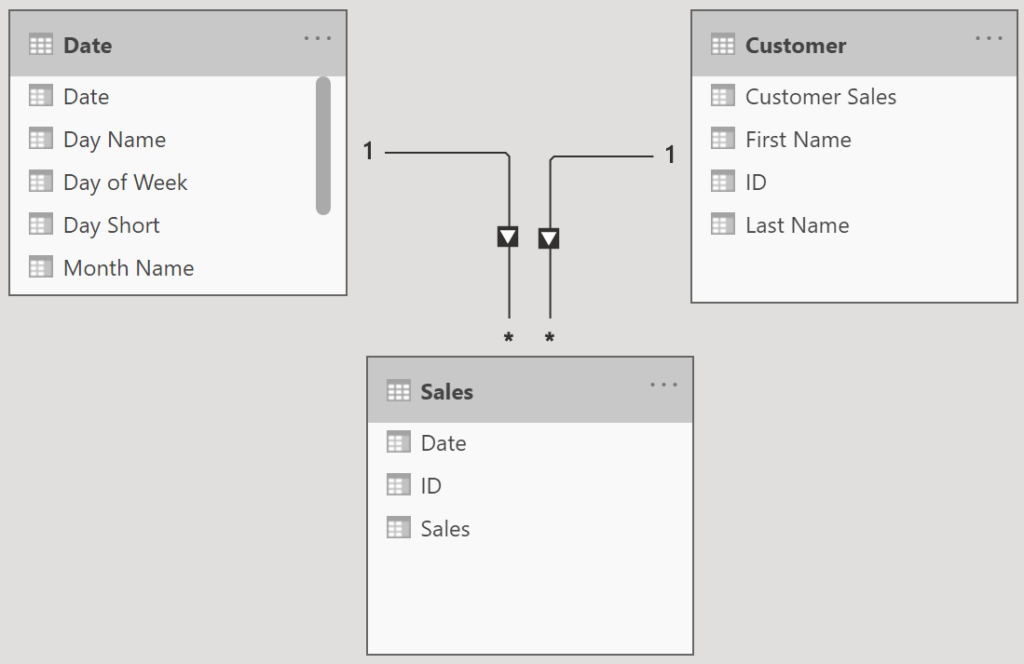
My DAX solution uses Tables Customer & Sales.
Solution
Concept
Sales table has repeating customer IDs with daily sales. We need to:
- aggregate all the sales for each customer
- filter out those with less than $10000
- count remaining customers
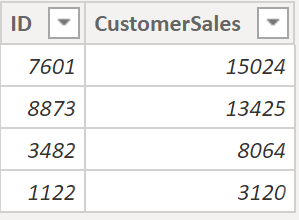
Step 1 Aggregate
SUMMARIZECOLUMNS(Customer[ID],
                 "CustomerSales", SUM(Sales[Sales]))
SUMMARIZECOLUMNS creates a summary table. It sums column Sales for each Customer ID. It gives us this:
How can we see the values above? Aren’t the values created virtually inside the measure? Yes, that’s true.
For demo purposes I created a table to see the values. Not a best practice as creating tables increases the file size.
On the ribbon select: Modeling / New Table (and use code below).
zAggregatedSalesbyCustomer = SUMMARIZECOLUMNS(Customer[ID],
                        "CustomerSales", SUM(Sales[Sales]))
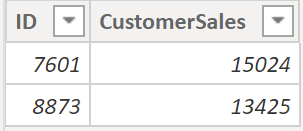
Step 2 Filter
zAggregatedSalesbyCustomer2 =
  FILTER(
       SUMMARIZECOLUMNS(Customer[ID],
                        "CustomerSales", SUM(Sales[Sales])
       ),
       [CustomerSales] > 10000)
Now only these customers qualify:
The 2 rows above are virtual and inside the measure. For demo purposes you can create a table using this DAX to see them:
zAggregatedSalesbyCustomer2 =
  FILTER(
       SUMMARIZECOLUMNS(Customer[ID],
                        "CustomerSales", SUM(Sales[Sales])
       ),
       [CustomerSales] > 10000)
Step 3 count rows
Finally, add COUNTROWS function to end up with the final measure:
Count Customers with more than X in Sales =
COUNTROWS(
  FILTER(
       SUMMARIZECOLUMNS(Customer[ID],
                        "CustomerSales", SUM(Sales[Sales])
       ),
       [CustomerSales] > 10000
  )
)
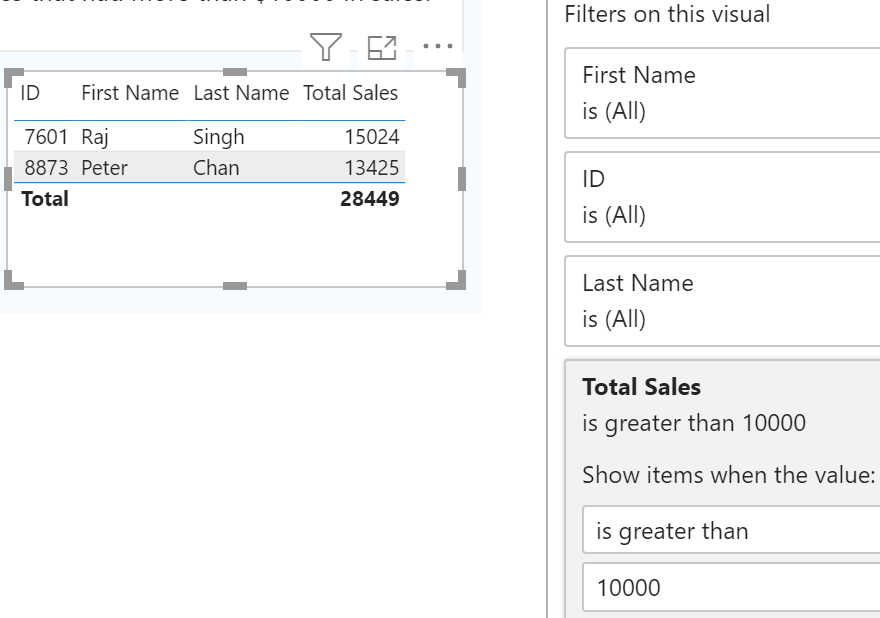
Bonus Question1: Who are they?
Who are the 2 customers with more than $10000 in sales?
Solution1 uses a calculated column and a filter (or a slicer).
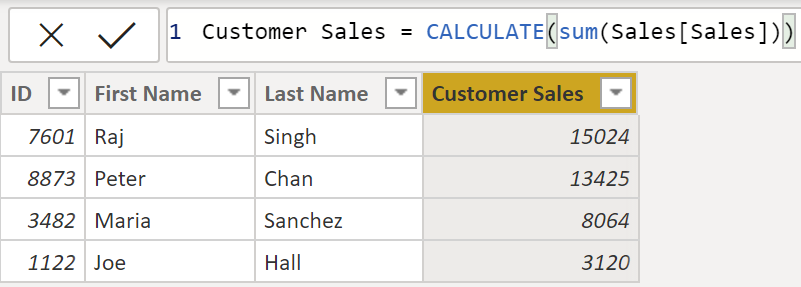
Customer table is a dim table. If it’s a short table then adding this column to the data model might not increase the file size much.
However, I can also solve this using only a measure and a filter. We’ve already got measure ‘Total Sales’ so I use it in the viz and viz filter:
Bonus Question2: Variable X amount
Up until now we’ve used the $10000 amount limit as a constant. How can we vary this amount? I’ll create a parameter and use it in a measure.
Step 1: create a parameter
On the ribbon select: Modeling / New parameter. Fill it out like this:
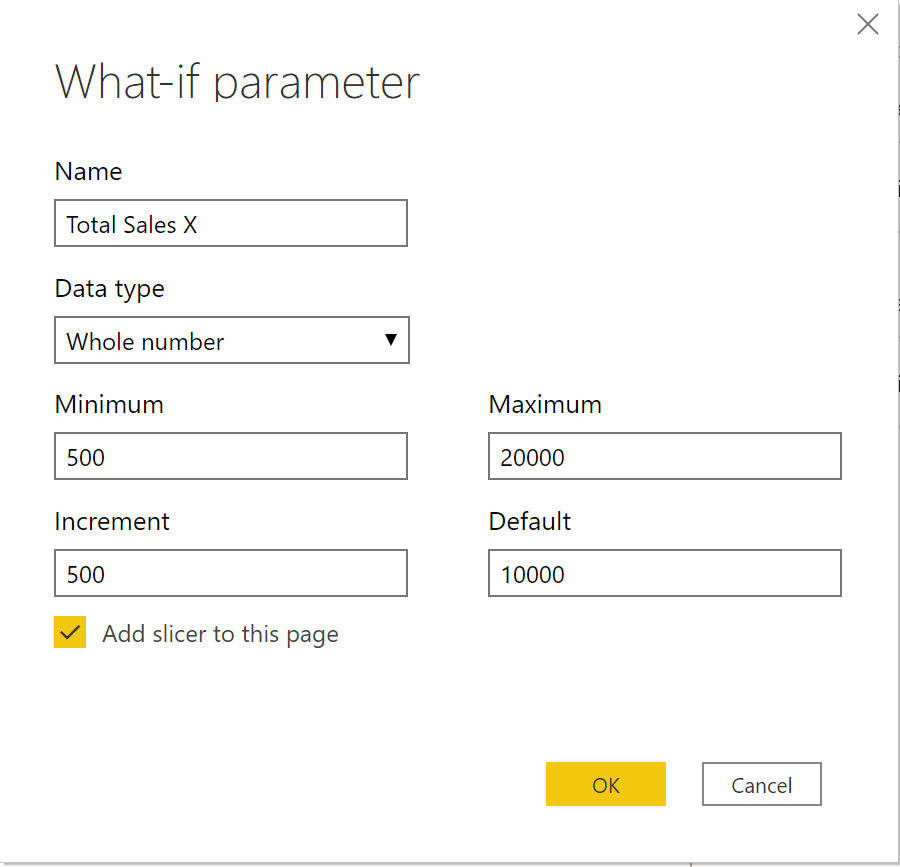
After pressing ‘OK’ several things happen:
- a 1 column table called ‘Total Sales X’ is created. The DAX code used to create the table can be modified.
Total Sales X = GENERATESERIES(500, 20000, 500)
- a measure to get/harvest the selected value is created.
Total Sales X Value = SELECTEDVALUE('Total Sales X'[Total Sales X], 1000)
Step 2: Use parameter value in measure
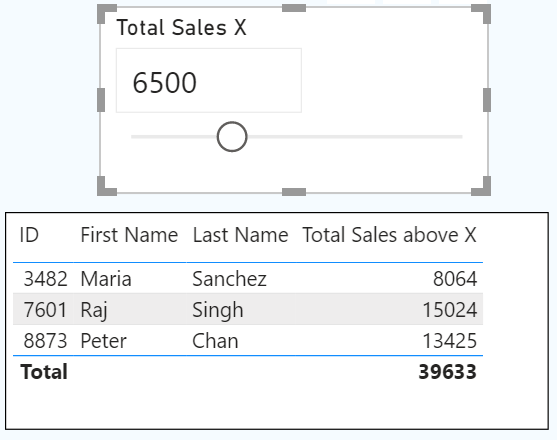
My new measure will calculate the same thing as measure ‘Total Sales’ but only for customers whose total sales amount is greater than the current parameter value.
Total Sales above X =
if(SUM(Sales[Sales]) > 'Total Sales X'[Total Sales X Value], SUM(Sales[Sales]), BLANK())
Note: use of functions IF and BLANK. Customers that evaluate to blank will not appear in the visual.
Below, the slicer allows me to easily change the amount and the viz updates.
Summary
Now that I’m building things, opposed to only studying, I’m starting to feel more comfortable with DAX. I also get practice with basic visual functionality. Practicing is essential (SQLBI agrees).
DAX function links
- SUMMARIZECOLUMNS https://dax.guide/summarizecolumns/
- FILTER https://dax.guide/filter/
- GENERATESERIES https://dax.guide/generateseries/
- SELECTEDVALUE https://dax.guide/selectedvalue/