Let’s use DAX to see if transaction data adheres to the 80-20 rule.
80-20 Rule
Concept is that 80% of outcomes result from 20% of all causes for an event. Often used to identify the most productive inputs and prioritize them.
Requirement
Some products have more sales than others. I want to see how many of the 18 products are needed to reach 80% of total sales.
File: Pbix
Set-up
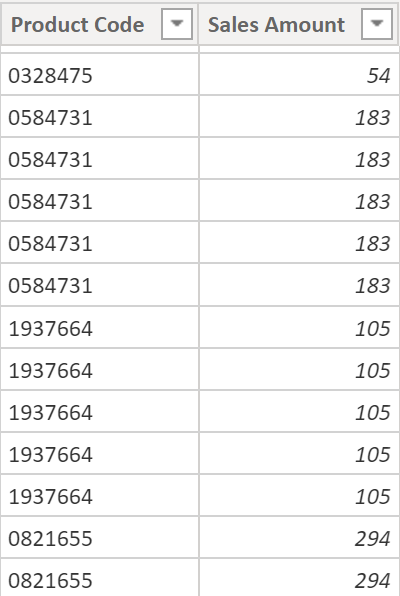
Product table has 18 Product Codes. Normally a dimension table like this would have more columns describing each product. For simplicity I have 1.

Table Sales has 90 rows (transactions). 5 for each product.
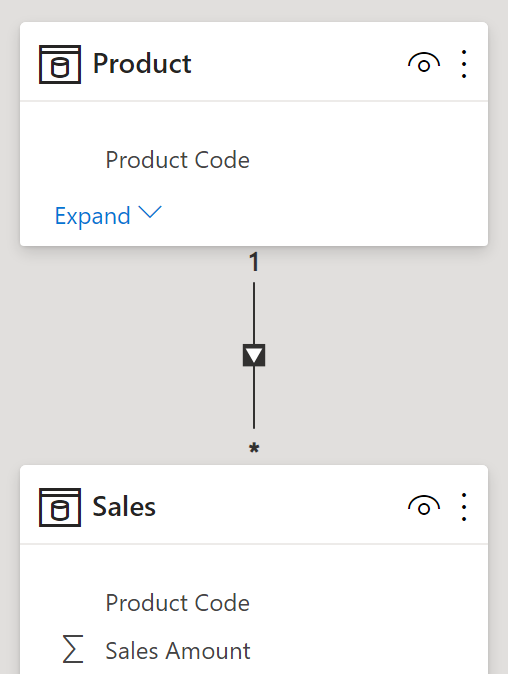
I added a 1 to many relationship between Product and Sales.
Solution
4 calculated columns to determine the products needed to reach 80% of sales.

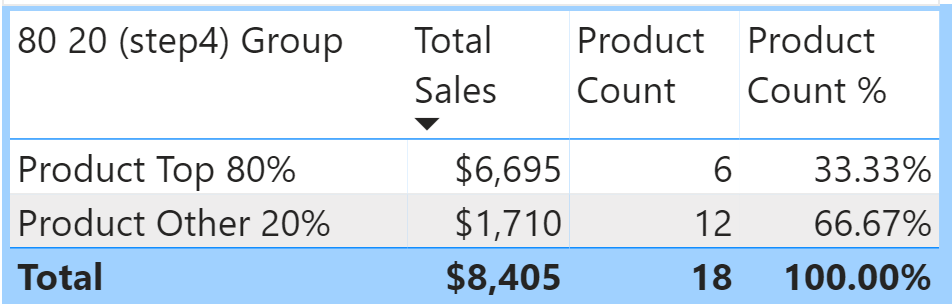
Final visual shows us only 6 (33.33%) products produce bulk of sales.
80 20 (step1) Product Sales
I calculate sales for each individual product. CALCULATE([Total Sales]) works but CALCULATE with ALLEXCEPT (definition) is more specific. “//” indicates a comment.
80 20 (step1) Product Sales =
//CALCULATE([Total Sales])
CALCULATE([Total Sales],ALLEXCEPT('Product','Product'[Product Code]))
Step 1 shows each product’s sales. Normally product sales amount is calculated using a SUM measure and then used in a visual but I need these amounts visible in a table.

80 20 (step2) Product Sales RT
RT = running total (aka expanding/cumulative). Slow on a transaction table like Sales but a Product table is smaller (each product is listed only once).
The variable gets the current product’s sales. FILTER creates a table with sales >= the variable. SUMX sums qualifying amounts from FILTER.
80 20 (step2) Product Sales RT =
VAR CurrentRowAmount = 'Product'[80 20 (step1) Product Sales]
RETURN
SUMX(
     FILTER(
            'Product',
            'Product'[80 20 (step1) Product Sales] >=CurrentRowAmount
     ),
     'Product'[80 20 (step1) Product Sales]
)

80 20 (step3) RT%
Current row’s running total as percent of total sales. CALCULATE with ALL gives us grand total sales amount.
80 20 (step3) RT% =
DIVIDE('Product'[80 20 (step2) Product Sales RT],
       CALCULATE([Total Sales],ALL())
)

80 20 (step4) Group
Labels rows ‘Product Top 80%’ or ‘Product Other 20%’. Used in final visual.
80 20 (step4) Group =
IF('Product'[80 20 (step3) RT%]<=0.8,
   "Product Top 80%",
   "Product Other 20%")

Bonus Solution
File: pbix
Requirement
How can I modify 80-20 to 85-15 and also have a dynamic description?
Make Target Amt Visible
I added this calculated column. Now target amount is visible in a column (not hidden inside the DAX as in original solution).
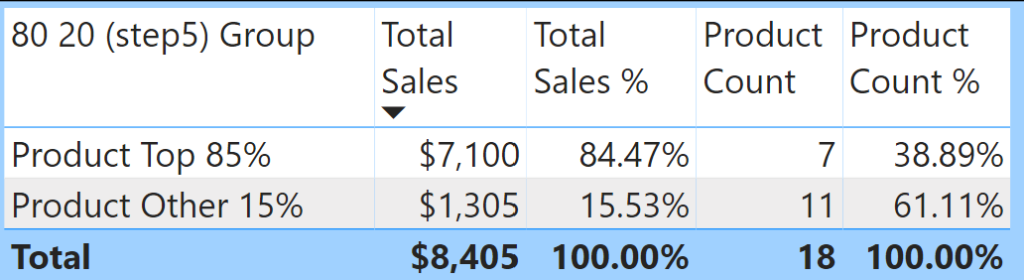
80 20 (step4) Group = 0.85
Change it to desired decimal value (0.85 = 85-15). It’s used in step 5 below to build the text description (also used in measure ‘Products Top X % Label’).
80 20 (step5) Group =
VAR topX = 'Product'[80 20 (step4) Group]
VAR bottomX = 1-topX
RETURN
IF('Product'[80 20 (step3) RT%]<=topX,
   "Product Top "&FORMAT(topx, "##,#%"),
   "Product Other "&FORMAT(bottomX, "##,#%"))
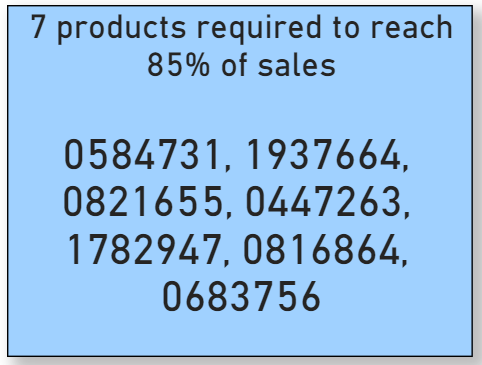
Top X Product Codes Viz
Measure ‘Products Top X %‘ concatenates Product Codes. Measure ‘Products Top X % Label’ is a dynamic Title (select visual, Format, Title).
Products Top X % =
CONCATENATEX (
    FILTER (
        'Product',
        LEFT ( 'Product'[80 20 (step5) Group], 11 ) = "Product Top"
    ),
    'Product'[Product Code],
    ", "
)
Products Top X % Label =
VAR Xamount =
 MIN('Product'[80 20 (step4) Group])
VAR countprodtop =
 COUNTROWS(FILTER('Product',LEFT('Product'[80 20 (step5) Group],11)="Product Top"))
VAR texttop =
 countprodtop & " products required to reach "&FORMAT(Xamount,"##,#%")&" of sales"
RETURN
texttop
Below the same measure with comments, additional variable, line breaks. It’s longer but easier to read.
Products Top X % Label =
//harvest target amount and format it
VAR Xamt = MIN('Product'[80 20 (step4) Group])
VAR Xamtf = FORMAT(Xamt,"##,#%")

//count products in the top X group.
VAR counttopX =
 COUNTROWS(
     FILTER('Product',LEFT('Product'[80 20 (step5) Group],9)="Product T"))

//build the final text used in dynamic title
VAR texttop =
  counttopX & " products required to reach " & Xamtf & " of sales"

RETURN
texttop
Sample Data
I explored 4 ways to create the data for table Sales here. Basic data-set but good for focusing on the concept.
Summary
Calculated Columns
In a fact table (Sales) they aren’t a good idea (fact tables can be very large). In this post they are in a dimension table (Product) that is much smaller.
Bonus Solution
I explored how to harvest the target amount and use it in visuals as a dynamic title and dynamic row text (not possible in my original solution as the 0.8 amount was inside calculated column DAX).
Measure Solution?
Can I create a solution using less (no?) calculated columns and more measures? Is it possible?