1st: a vague requirement that needs clarifying. 2nd: a puzzle to solve via a journey of DAX discovery!
?Requirement?
What’s the average discounted sales per customer?
It might sound clear but once we look at the data it becomes obvious that this question could be interpreted in different ways. Let’s look at the data.
Set-up
My pbix file
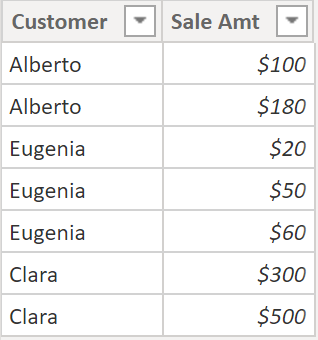
Sales Table
Each row is a sale to a customer.
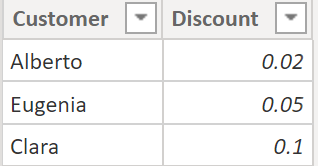
Customer Table
Each customer’s discount amount.
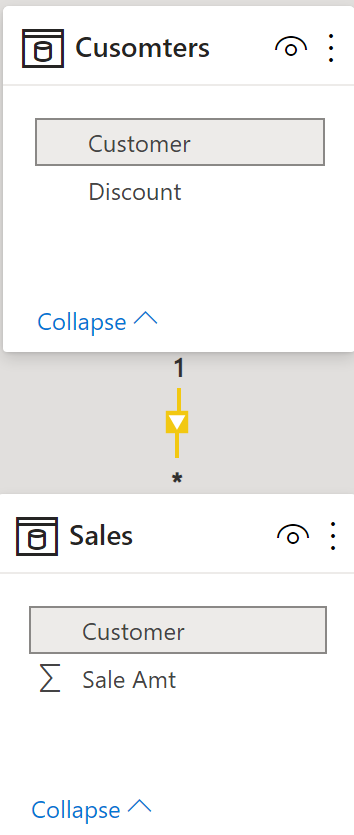
Relationship
One to many (Customers to Sales). A customer can have 1+ rows in Sales.
Interpretation
Now I’ve seen the data but how do I interpret the requirement?
What’s the average discounted sales per customer?
I needed to clearly understand it before creating a measure.
Asking Questions
I reduced it down to two questions:
- How should it calculate at the row level?
- How should it calculate at the total level?
Excel Demo
To explain different Customer row & Total row possibilities.
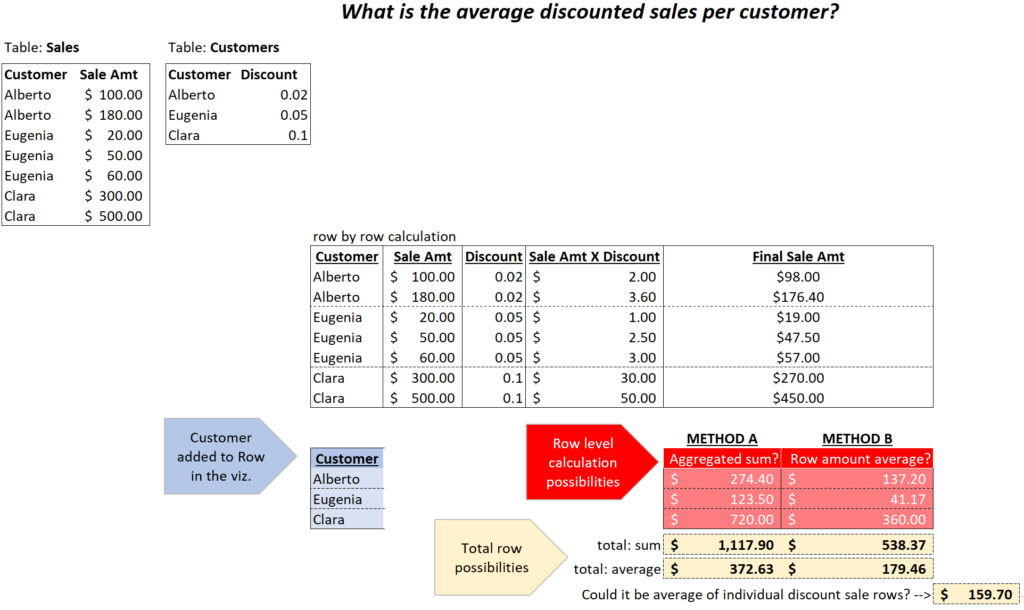
I listed 4 possibilities:
- METHOD A & total: sum. Or simply: sum & sum
- METHOD A & total: average. Or simply: sum & average
- METHOD B & total: sum. Or simply: average & sum
- METHOD B & total: average. Or simply: average & average
Some seem to make more sense than others but the requestor decides.
Clear Requirement!
The questions helped and we ended up with this:
for each Customer sum the discount sales. In total row show average of Customer amounts above.
Now it’s time to solve this!
Solution
I’ll show the final visual and measure. Then I’ll dive into why one measure doesn’t work and why 2 measures do work.
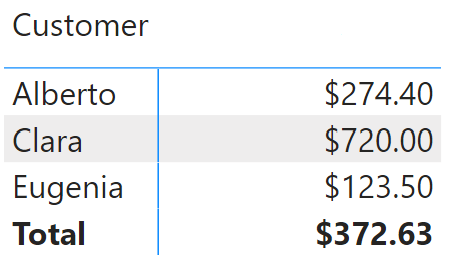
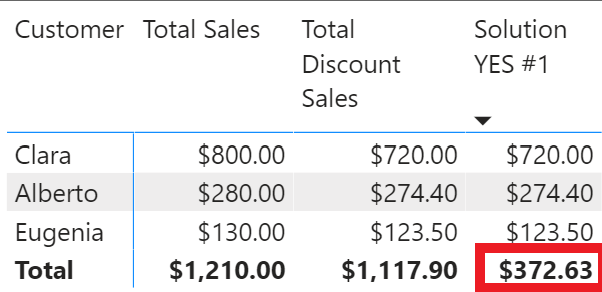
Final Visual
This is what I need to build:
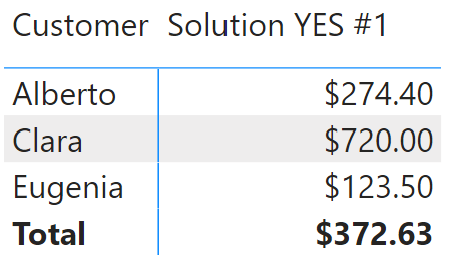
Final Measure
Both measures work but in different ways:
Solution YES #1 =
AVERAGEX(
  Customers,
  SUMX(RELATEDTABLE(Sales), Sales[Sale Amt] * (1 - Customers[Discount])))
Solution YES #2 =
VAR RowCalc =
         SUMX(Sales,Sales[Sale Amt] * (1- RELATED(Customers[Discount])))
VAR TotalCalc =
         AVERAGEX(Values(Customers[Customer]), [Total Discount Sales])
RETURN
IF( HASONEVALUE(Customers[Customer]), RowCalc, TotalCalc)
Solution Journey
I’ll walk through my journey. I got stuck a few times but l learned so much!
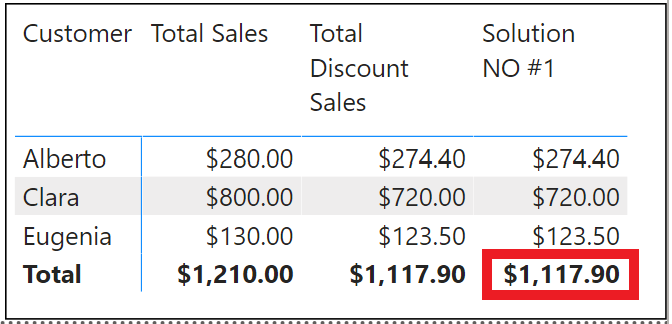
Failed Attempt #1
Remember, we want to create this:
Solution NO #1 =
AVERAGEX(Customers,
         SUMX(Sales,Sales[Sale Amt] * (1- RELATED(Customers[Discount]))))
AVERAGEX ( <Table>, <Expression> )
I thought it would work in both row level & total level.
- Row: calculate <Expression> for the current Customer
- Total: iterate each row in <Table>, calculate <Expression>, average results
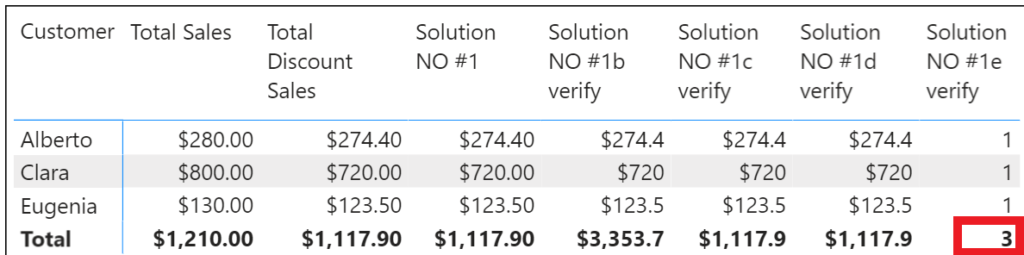
Below ‘Solution NO #1’ doesn’t work at total level. Why does it sum when I’m using AVERAGEX to average $274.4 $720.0 $123.5 ?
In Excel I can evaluate part of a formula (F9 key) to see what’s inside. I can’t do that in Power BI but I thought of this:
Look Inside Measure
I changed AVERAGEX to SUMX to test an idea.
Solution NO #1b verify =
SUMX(Customers,
         SUMX(Sales,Sales[Sale Amt] * (1- RELATED(Customers[Discount]))))
Look at the $3353.7 total below!!!
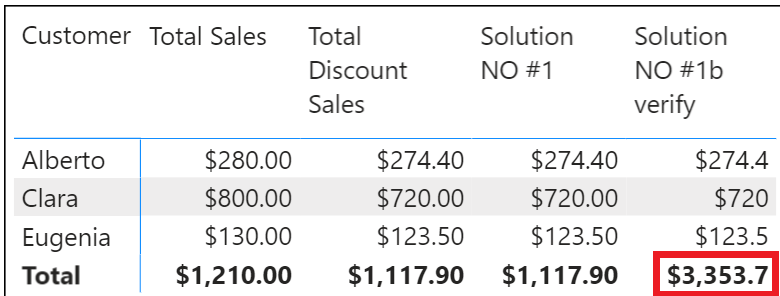
$3353.7 = $1117.9 X 3 my measure isn’t iterating over each customer. It’s the total 3 times! There’s a disconnect between <Table> and <Expression>.
To prove it I created these:
Solution NO #1c verify =
MINX(Customers,
         SUMX(Sales,Sales[Sale Amt] * (1- RELATED(Customers[Discount]))))
Solution NO #1d verify =
MAXX(Customers,
         SUMX(Sales,Sales[Sale Amt] * (1- RELATED(Customers[Discount]))))
As I suspected, MINX and MAXX both produce $1117.9 !!

To be extra sure that $1117.9 is there 3 times I created this:
Solution NO #1e verify =
COUNTX(Customers,
         SUMX(Sales,Sales[Sale Amt] * (1- RELATED(Customers[Discount]))))
Total row for measure ‘Solution NO #1e verify‘ counts 3 numbers!
Solution #1
Inside SUMX I removed RELATED from the <Expression> and added RELATEDTABLE to the <Table> part.
Solution YES #1 =
AVERAGEX(Customers,
         SUMX(RELATEDTABLE(Sales),Sales[Sale Amt] * (1- Customers[Discount])))
Remember the disconnect? I want to stay inside table Customers to do my X expression. RELATEDTABLE pulls the data from Sales up to Customers.
X functions (SUMX, MAXX) iterate a column in the same table. Sales column [Sales Amt] is outside of Customers. RELATEDTABLE goes down to Sales, gets it, and performs a context transition (link).
Customers[Discount] is already in table Customer.
How can I be sure? What numbers are inside the measure?
Look Inside Measure
Each measure below extracts a different number to prove what’s inside!
Solution YES #1c verify =
MINX(Customers,
     SUMX(RELATEDTABLE(Sales),Sales[Sale Amt] * (1- Customers[Discount])))
Above, measure ‘Solution YES #1c verify’ returns $123.50 (MINX).
Solution YES #1e verify =
MEDIANX(Customers,
        SUMX(RELATEDTABLE(Sales),Sales[Sale Amt] * (1- Customers[Discount])))
Above, measure ‘Solution YES #1e verify’ returns $274.40 (MEDIANX).
Solution YES #1d verify =
MAXX(Customers,
     SUMX(RELATEDTABLE(Sales),Sales[Sale Amt] * (1- Customers[Discount])))
Above, measure ‘Solution YES #1d verify’ returns $720.00 (MAXX).
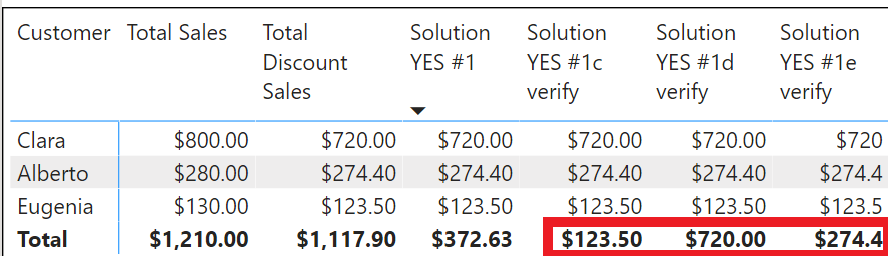
Average of $123.5 & $274.4 & $720.0 is $372.63! (Solution YES #1)
Solution #2
It wasn’t easy to create a measure to calculate differently at row and total levels. Why not use function HASONEVALUE to distinguish between row and total and then do an simpler calculations?
Solution YES #2 =
VAR RowCalc =
         SUMX(Sales,Sales[Sale Amt] * (1- RELATED(Customers[Discount])))
VAR TotalCalc =
         AVERAGEX(Values(Customers[Customer]), [Total Discount Sales])
RETURN
IF( HASONEVALUE(Customers[Customer]), RowCalc, TotalCalc)
Where am I?
IF and HASONEVALUE functions determine if the row has a Customer (runs RowCalc) or if it’s the total row (runs TotalCalc).
VAR RowCalc
If there’s a Customer in the row then variable RowCalc iterates table Sales to multiply: [Sale Amt] X Customers[Discount]. RELATED gets the [Discount] value for current row [Customer]. Customer in viz is the filter context so SUMX only iterates current customer’s rows.
VAR TotalCalc
TotalCalc uses VALUES to create a table of customers to iterate. I don’t want to average the original column but average [Total Discount Sales] per Customer.
Be Careful
If you copy the DAX for measure [Total Discount Sales] and paste it inside Solution YES #2 (to replace external reference) it won’t work. Why?
When referencing an external measure an invisible CALCULATE is wrapped around it. If the DAX is used directly inside the measure then wrap it with a CALCULATE to get context transition. Compare two measures below:
Solution YES #2b NO =
//this measure no longer works
VAR RowCalc =
         SUMX(Sales,Sales[Sale Amt] * (1- RELATED(Customers[Discount])))
VAR TotalCalc =
         AVERAGEX(Values(Customers[Customer]), SUMX(Sales,Sales[Sale Amt] * (1- RELATED(Customers[Discount]))))
RETURN
IF( HASONEVALUE(Customers[Customer]), RowCalc, TotalCalc)
Above measure no longer works but measure below works:
Solution YES #2c YES =
//by adding the CALCULATE function this measure works and no longer relies on external measure
VAR RowCalc =
         SUMX(Sales,Sales[Sale Amt] * (1- RELATED(Customers[Discount])))
VAR TotalCalc =
         AVERAGEX(Values(Customers[Customer]),
                  CALCULATE(SUMX(Sales,Sales[Sale Amt] * (1- RELATED(Customers[Discount])))))
RETURN
IF( HASONEVALUE(Customers[Customer]), RowCalc, TotalCalc)
I continued to play with context transition. Can I remove TotalCalc’s CALCULATE and replace it with CALCULATETABLE? It works!
Solution YES #2d YES =
VAR RowCalc =
         SUMX(Sales,Sales[Sale Amt] * (1- RELATED(Customers[Discount])))
VAR TotalCalc =
         AVERAGEX(Values(Customers[Customer]),
                  SUMX(CALCULATETABLE(Sales),Sales[Sale Amt] * (1- RELATED(Customers[Discount]))))
RETURN
IF( HASONEVALUE(Customers[Customer]), RowCalc, TotalCalc)
So, context transition must occur but there’s more than one way to do it!
DAX Discovery Journey
This was exhausting but rewarding as I learned why my initial solution wasn’t working, how to fix it and prove how it worked.
Great advice from Adam Saxton re: learning DAX (Youtube link)
The struggle is real. And this is something that Patrick and I had to go through as well. Everyone that’s learning this has to go through that knowledge ramp and you are not alone.
My nephew sent me an amazing book called ‘Burn Math Class: And Reinvent Mathematics for Yourself’. So many great quotes. Here’s one
…an approach that requires zero memorization, encourages experimentation and failure, never asks the reader to accept anything we have not created ourselves, avoids fancy names that hide the simplicity of the idea, and presents mathematics like the adventure it is…
Learning DAX, or anything, does require a lot of experimenting and failing. If I keep at it I’ll have more eureka moments when I understand a challenging concept.
Demo Data
The relationship between Sales and Customers would normally use an ID number (not text name field). I kept it simple for this demo.
This time I used a simpler DAX approach via function DATATABLE:
Sales =
VAR tablesales =
DATATABLE (
    "Customer", STRING,
    "Sale Amt", CURRENCY,
    {
        { "Alberto", 100 },
        { "Alberto", 180 },
        { "Eugenia",  20 },
        { "Eugenia",  50 },
        { "Eugenia",  60 },
        { "Clara",  300 },
        { "Clara",  500 }
    }
)
RETURN
tablesales
Boring but this is all I needed. Some richer ways to create sample data:
- Repeating rows to create sample data II – Practice Power BI
- Repeating Rows to create sample data – Practice Power BI
Another down side of a light demo is that we don’t get to see how efficiently it runs. I need to practice with larger sample data-sets.