I heard that it’s a bad idea to add a counter inside a visual. But can I do it?
Concept
I recently tried to add a counter inside a visual using DAX. It’s a bad idea (super slow!) but I did it and I learned a lot!
Counter can’t be hardcoded in a table as date slicer changes what the viz displays.
Warning!
DON’T DO THIS IN YOUR PRODUCTION VISUALS…this is just for learning.
Files
Visual
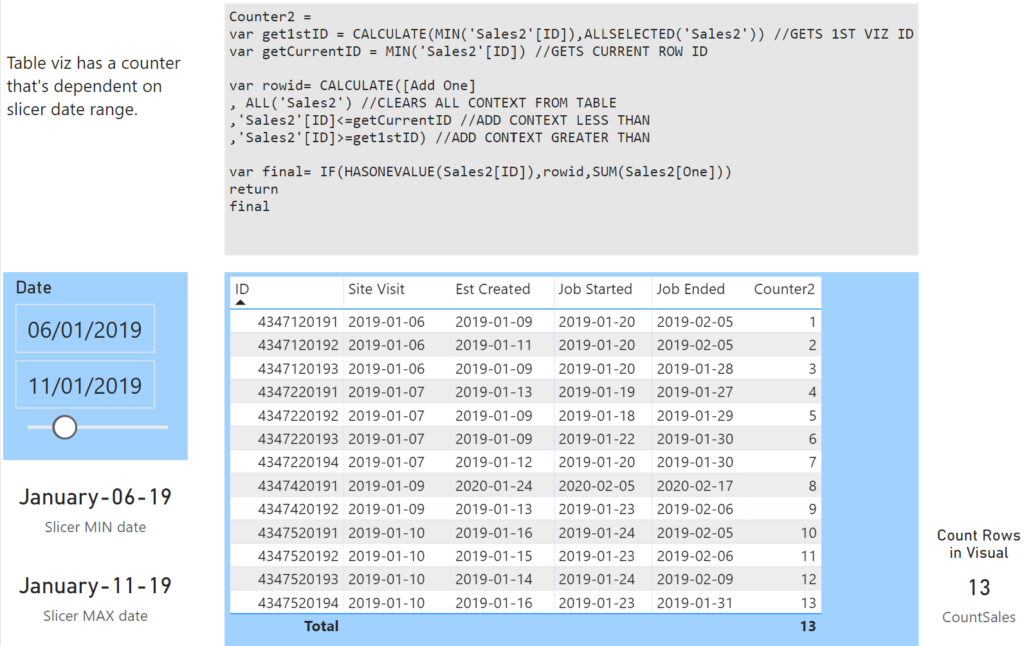
Report ‘Counter in a visual’ seen below has:
- two text boxes (at top)
- a slicer
- 3 measures (2 bottom left, 1 bottom right)
- 1 table viz (5 fields, 1 measure)
Measure Counter2 seen in viz proves that it’s possible to create a viz counter:

Table Sales2
Measure Counter2, seen in viz above, depends on two fields from fact table Sales2:
- a numerical PK (ID)
- field One (has hard coded 1)

A fact table may not have a primary key. Field One increases file size but has a single value of 1 (light). Once again, adding a viz counter is not recommended but it was a great DAX challenge!
DAX Counter
I’ve included 4 versions of my counter measure:
- Counter: my first attempt. Total always shows 1
- Counter Blank: total is blank
- Counter2: total shows max counter ID
- Counter3: total shows max counter ID (like Counter2)
Counter
I got confused playing with this so I added comments to each variable:
- var get1stID get the 1st ID value currently in the visual
- var getCurrentID get the current row ID value
- var final the final calc to create incrementing counter
Counter =
//GETS 1ST VIZ ID
var get1stID = CALCULATE(MIN('Sales2'[ID]),ALLSELECTED('Sales2'))

//GETS CURRENT ROW ID
var getCurrentID = MIN('Sales2'[ID])

var final= CALCULATE([Add One]
, ALL('Sales2') //CLEARS ALL CONTEXT FROM TABLE EXCEPT [ID]
,'Sales2'[ID]<=getCurrentID //ADD CONTEXT LESS THAN
,'Sales2'[ID]>=get1stID) //ADD CONTEXT GREATER THAN

return
final
var final adds 1s between get1stID and getCurrentID (like a running total). Total row always shows “1”.
Counter Blank
I added HASONEVALUE to identify the total row and leave it blank:
Counter Blank =
//GETS 1ST VIZ ID
var get1stID = CALCULATE(MIN('Sales2'[ID]),ALLSELECTED('Sales2'))

//GETS CURRENT ROW ID
var getCurrentID = MIN('Sales2'[ID])

var calc= CALCULATE([Add One]
, ALL('Sales2') //CLEARS ALL CONTEXT FROM TABLE EXCEPT [ID]
,'Sales2'[ID]<=getCurrentID //ADD CONTEXT LESS THAN
,'Sales2'[ID]>=get1stID) //ADD CONTEXT GREATER THAN

return
IF(HASONEVALUE(Sales2[ID]),calc, blank())
Counter2
Total sums all of field One within current filter context (slicer date range).
Counter2 =
var get1stID = CALCULATE(MIN('Sales2'[ID]),ALLSELECTED('Sales2')) //GETS 1ST VIZ ID
var getCurrentID = MIN('Sales2'[ID]) //GETS CURRENT ROW ID

var rowid= CALCULATE([Add One]
, ALL('Sales2') //CLEARS ALL CONTEXT FROM TABLE
,'Sales2'[ID]<=getCurrentID //ADD CONTEXT LESS THAN
,'Sales2'[ID]>=get1stID) //ADD CONTEXT GREATER THAN

var final= IF(HASONEVALUE(Sales2[ID]),rowid,SUM(Sales2[One]))
return
final
Counter3
In var final I tried to modify CALCULATE to not need an external measure. Hmm… CALCUALTE appears to require an external measure expression [Add One].
Counter3 =
var sumone = sum(Sales2[One])
var get1stID = CALCULATE(MIN('Sales2'[ID]),ALLSELECTED('Sales2')) //GETS 1ST VIZ ID
var getCurrentID = MIN('Sales2'[ID]) //GETS CURRENT ROW ID

var final= CALCULATE([Add One]
, ALL('Sales2') //CLEARS ALL CONTEXT FROM TABLE EXCEPT [ID]
,'Sales2'[ID]<=getCurrentID //ADD CONTEXT LESS THAN
,'Sales2'[ID]>=get1stID) //ADD CONTEXT GREATER THAN

return
IF(HASONEVALUE(Sales2[ID]), final, sumone)
Below is external measure [Add One] that is referenced above:
Add One = Sum(Sales2[One])
?ALL or ALLEXCEPT?
I originally used ALLEXCEPT inside the main CALCULATE function. It worked but I later realized I couldn’t explain why. I replaced ALLEXCEPT with ALL.
Inside CALCULATE the ALL function clears the context for field [ID]. The next two lines add back context to field [ID] to create an expanding range.
Performance Analyzer
Bad: my counter measures are incredibly slow and not practical.
Good: it’s an opportunity to use Performance Analyzer.
How to start it
- on ribbon select View
- below to the right select ‘Performance Analyzer’
- select ‘Start Recording’
- change a date in the slicer
- once finished press ‘Stop’
Results
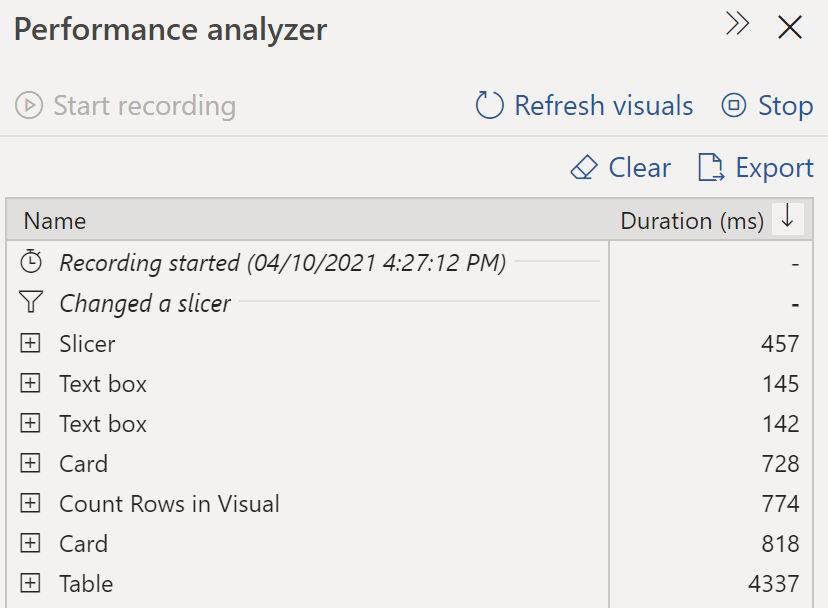
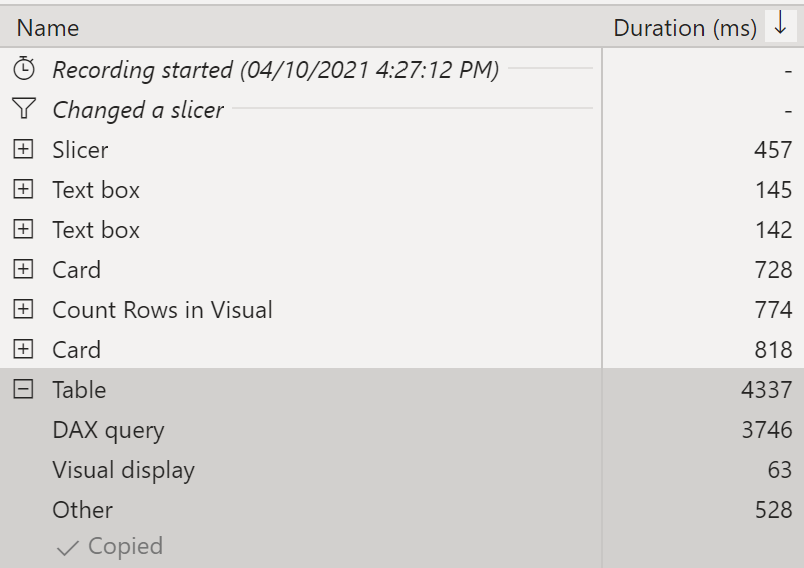
Not surprising that the table viz is the slowest to calculate (has measure Counter2). 4437 milliseconds.

Click the Table expand button to see more details:

Majority of time spent is on the DAX query. I clicked ‘copy query’ (now ‘Copied’).
Table DAX Query
Here’s the internal code to display the table viz:
// DAX Query
DEFINE
  VAR __DS0FilterTable =
    FILTER(
      KEEPFILTERS(VALUES('Date'[Date])),
      AND('Date'[Date] >= DATE(2019, 1, 7), 'Date'[Date] < DATE(2019, 1, 13))
    )

  VAR __DS0Core =
    SUMMARIZECOLUMNS(
      ROLLUPADDISSUBTOTAL(
        ROLLUPGROUP(
          'Sales2'[Est Created],
          'Sales2'[Job Started],
          'Sales2'[Job Ended],
          'Sales2'[Site Visit],
          'Sales2'[ID]
        ), "IsGrandTotalRowTotal"
      ),
      __DS0FilterTable,
      "Counter2", 'Sales2'[Counter2]
    )

  VAR __DS0PrimaryWindowed =
    TOPN(
      502,
      __DS0Core,
      [IsGrandTotalRowTotal],
      0,
      'Sales2'[ID],
      1,
      'Sales2'[Est Created],
      1,
      'Sales2'[Job Started],
      1,
      'Sales2'[Job Ended],
      1,
      'Sales2'[Site Visit],
      1
    )

EVALUATE
  __DS0PrimaryWindowed

ORDER BY
  [IsGrandTotalRowTotal] DESC,
  'Sales2'[ID],
  'Sales2'[Est Created],
  'Sales2'[Job Started],
  'Sales2'[Job Ended],
  'Sales2'[Site Visit]
Results without Counter2
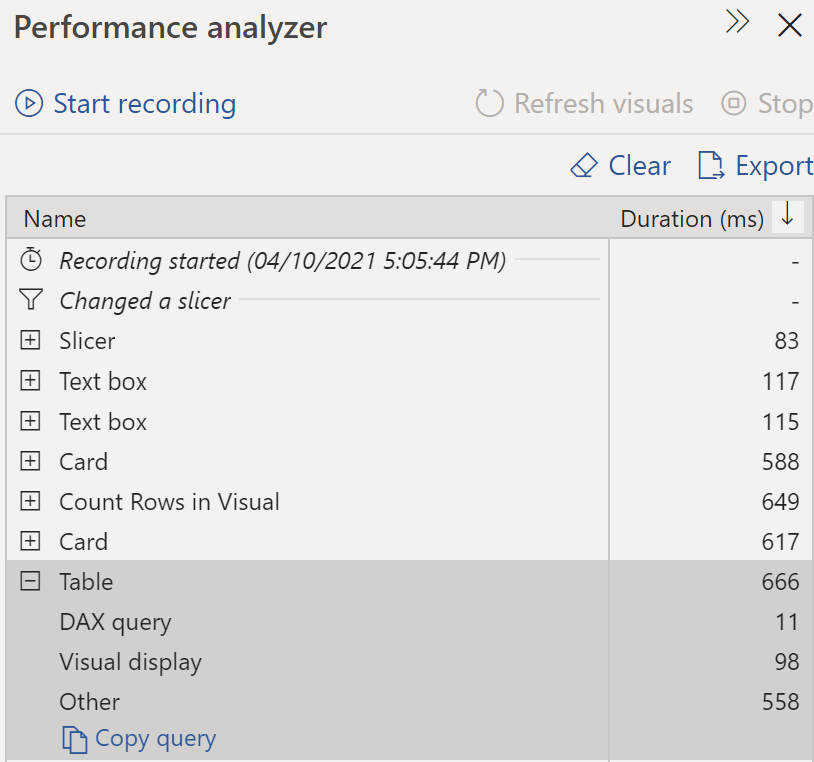
I removed measure Counter2 from the viz and reran the query.

No surprise that the Table is now much faster.
Support Site
Below my screenshots there’s a link to Support Site. It’s a PBI optimization guide with a ton of valuable information.
Recap
I almost gave up trying to create the visual counter. I was experimenting with so many different measures that it became confusing. Eventually I solved it thanks to my curiosity and stubbornness. DAX challenges are fun.