How can we sum individual daily totals and then average those numbers?
Requirement
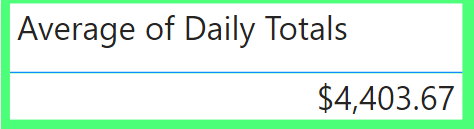
We want the average of all daily total sales.
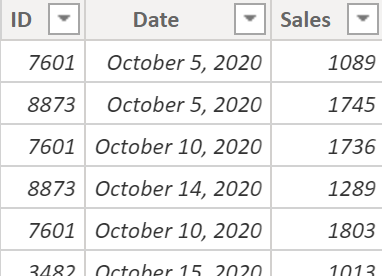
A single date could have multiple entries in table TblSales. I want to sum individual daily totals and then average those numbers to get a single value
Files: Pbix & Excel
Final Measure
Average of Daily Totals =
     AVERAGEX(VALUES('Date'[Date]), [Total Sales])
Setup
Raw Data
Table TblSales has 31 rows. Each row is a sale.
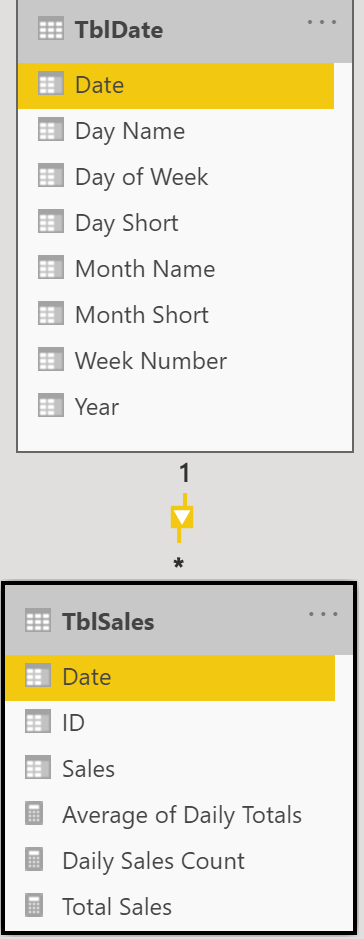
I created a date table called TblDate using M code. See full code at bottom.
I created a relationship between tables TblSales and TblDate.
Solution
Base Measure
I created [Total Sales] measure. I’ll use it inside the final measure.
Total Sales = SUM(TblSales[Sales])
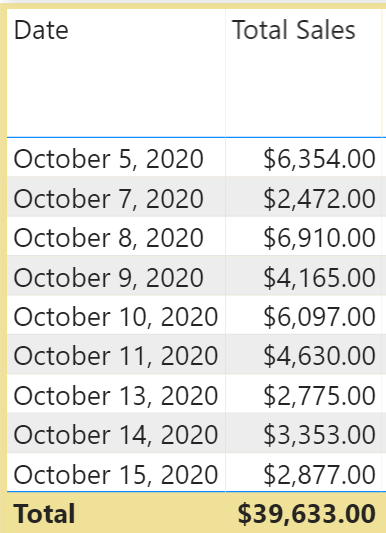
Used by itself, measure [Total Sales] gives us $39633.00 but I need to split this amount out for each day that has sales.
Final Measure
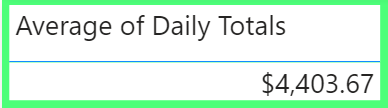
It’s called [Average of Daily Totals] and gives us a single answer of $4403.67
Average of Daily Totals =
     AVERAGEX(VALUES('TblDate'[Date]), [Total Sales])
Solution Explanation
Averagex Syntax
AVERAGEX( <table>, <expression>)
The table is: VALUES(‘TblDate'[Date]). The expression is: [Total Sales].
What does VALUES do?
VALUES function creates a table with a single column of dates. [Total Sales] expression is calculated for each date.
Invisible measure values
It’s bad practice to use DAX to create physical tables just to see virtual data inside a measure. I’ll do it for demo purposes.
On the ribbon click ‘Modeling’, ‘New Table’ and enter the DAX below.
zInsideMeasureAverageofDailyTotals = ADDCOLUMNS(VALUES('TblDate'[Date]), "Daily Sum", [Total Sales])
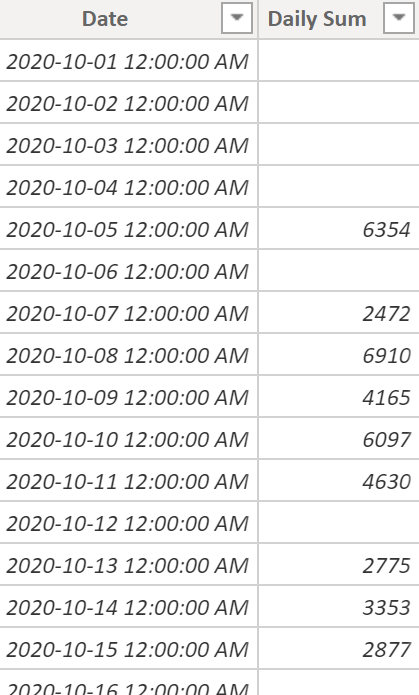
I see each Date and it’s [Total Sales] value (also days with no sales). This is a table (physical data). The beauty is that measure [Average of Daily Totals] creates these values internally!
Final Step: AVERAGEX
Now that we can physically see what’s inside function AVERAGEX it’s easier to understand. Final step is the average of [Total Sales] values.
BONUS: see Daily Totals & Avg
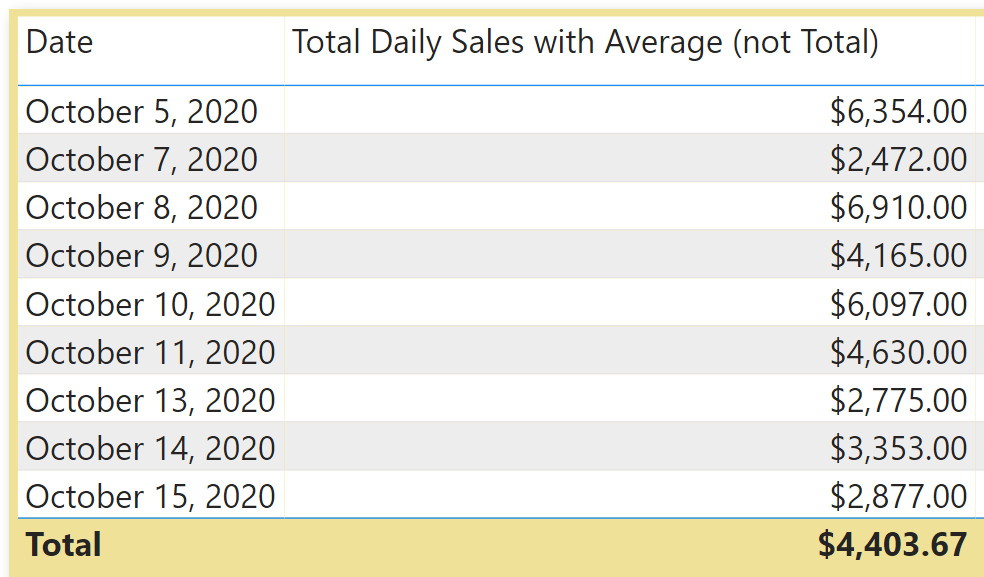
I can also display daily totals in a visual like this:
How would we average these numbers in the total row?
It’s possible using this measure:
Total Daily Sales with Average (not Total) =
if(
   NOT(HASONEVALUE(TblDate[Date])),
   AVERAGEX(VALUES('TblDate'[Date]), [Total Sales]),
SUM(TblSales[Sales]))
I get the same row values but total row is the average of numbers above!
How? The total row does not have a date. So, functions NOT and HASONEVALUE check for this and let us replace the default function for the total row (SUM) with something different. In this case it’s:
AVERAGEX(VALUES('TblDate'[Date]), [Total Sales]),
fancy code that gives us the average of the daily sums!
Date Table M Code
M code I used in Power Query to create table Date. Note: no dynamic start and end dates. It starts on Oct 1 2020 and has 31 dates. In a future post I’ll explore dynamic date tables.
let
    Source = List.Dates(#date(2020, 10, 1), 31, #duration(1, 0, 0, 0)),
    #"Converted to Table" = Table.FromList(Source, Splitter.SplitByNothing(), null, null, ExtraValues.Error),
    #"Renamed Columns" = Table.RenameColumns(#"Converted to Table",{{"Column1", "Date"}}),
    #"Changed Type" = Table.TransformColumnTypes(#"Renamed Columns",{{"Date", type date}}),

    #"Inserted Year" = Table.AddColumn(#"Changed Type", "Year", each Date.Year([Date]), Int64.Type),

    #"Inserted Month Name" = Table.AddColumn(#"Inserted Year", "Month Name", each Date.MonthName([Date]), type text),
    #"Inserted First Characters" = Table.AddColumn(#"Inserted Month Name", "Month Short", each Text.Start([Month Name], 3), type text),

    #"Inserted Week Number" = Table.AddColumn(#"Inserted First Characters", "Week Number", each Date.WeekOfYear([Date])),
    #"Changed Type1" = Table.TransformColumnTypes(#"Inserted Week Number",{{"Week Number", Int64.Type}}),

    #"Inserted Day Name" = Table.AddColumn(#"Changed Type1", "Day Name", each Date.DayOfWeekName([Date]), type text),
    #"Inserted Day of Week" = Table.AddColumn(#"Inserted Day Name", "Day of Week", each Date.DayOfWeek(([Date]), Day.Sunday)+1, Int64.Type),

    #"Inserted First Characters1" = Table.AddColumn(#"Inserted Day of Week", "Day Short", each Text.Start([Day Name], 3), type text),

    #"Reordered Columns" = Table.ReorderColumns(#"Inserted First Characters1",{"Date", "Year", "Month Name", "Month Short", "Day Name", "Day Short", "Day of Week"})

in
        #"Reordered Columns"
DAX Function Links
- AVERAGEX https://dax.guide/averagex/
- VALUES https://dax.guide/values/
- ADDCOLUMNS https://dax.guide/addcolumns/